 CROATIA

- Water Snapshot
- Context for Services
- Organization for Services
- Access to Services
- Performance of Services
- Financing of Services
- Water Sector Sustainability and Main Challenges
- Sources
WATER SNAPSHOT
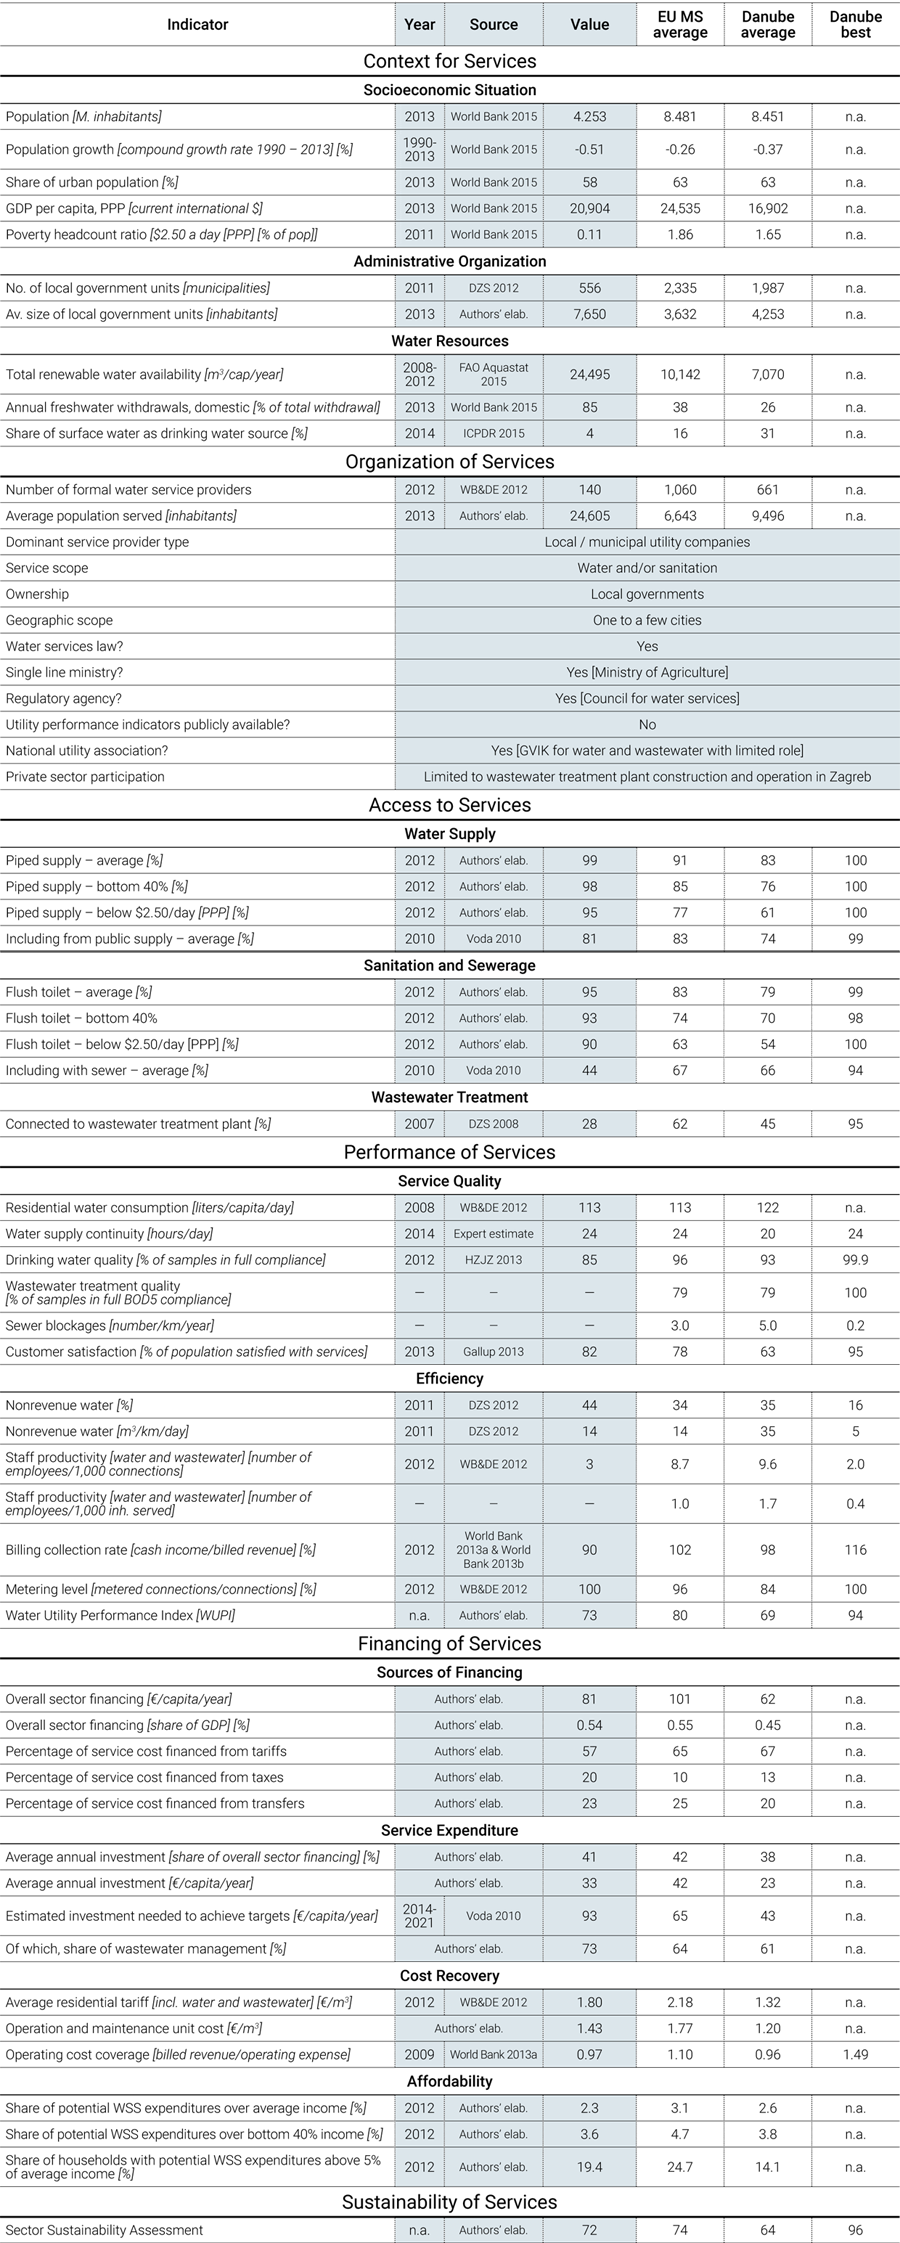
Sources for all numbers in the snapshot are provided in full in the body of this country page; a complete description of the methodology is provided in the State of the Sector Regional Report available under SoS.danubis.org/Report.
 |
 |
KEY WATER AND SANITATION SECTOR CHALLENGES
- Financing compliance with European Environmental Acquis. Croatia committed to comply with the European water-related directives by 2023. Total investment needed is estimated at close to € 3.75 billion.
- Ensuring the affordability of future tariffs. Construction and operation of the new infrastructure to comply with Environmental Acquis will require substantial tariff increases, which might become unaffordable for lower-income part of population.
- Implementing successfully the Aggregation Reform. The Government has decided to merge the municipal utility companies into 20 regional utilities (Uredba o granicama uslužnh područja NN67/14). Focus on actual efficiency gains and better services will be crucial for success.
- Strengthening the regulation in the water sector. The Water Services Council is the economic regulator exclusively for water and sanitation services. Despite the well-developed legal and regulatory framework, the Council is still in the process of fully deploying its regulatory reach.
FURTHER RESOURCES
On water services in the Danube Region
- A regional report analyzing the State of Sector in the region, as well as detailed country notes for15 additional countries, are available under SoS.danubis.org
- Detailed utility performance data is accessible, if available, under www.danubis.org/database
On water services in Croatia
The following documents are recommended for further reading; the documents, and more, are available at www.danubis.org/eng/country-resources/croatia
-
Belgium. 2012. Waste and Water Management in Croatia. Zagreb: Embassy of Belgium in Croatia, Commercial Section.
-
UNECE. 2014. Environmental Performance Reviews, Croatia, Second Review. Geneva: United Nations Economic Commission for Europe.
-
Voda. 2010. Implementation Plan for Water Utility Directives. Zagreb: Croatian Waters.
CONTEXT FOR SERVICES
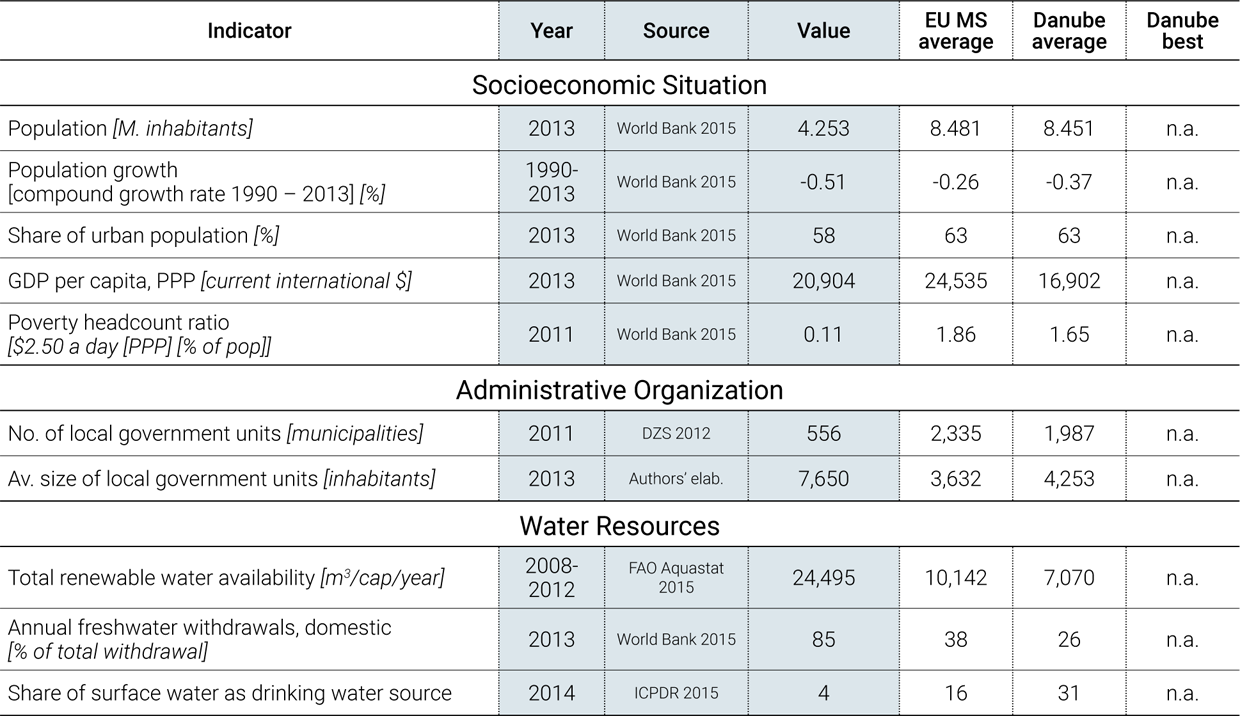
Economy. Croatia, which joined the EU on July 1, 2013, is a middle-income country with limited inequalities and poverty issues. Croatia has 4.25 million inhabitants, according to World Bank Development Indicators 2015. Fifty-eight percent of the population lives in urban settings, and the country is relatively densely populated at 75.6 inhabitants/km2. At US$20,904 GDP per capita, Croatia is considered a high-income country; the overall economic situation is, however, challenging, with unemployment around 18% and GDP declining over the last 5 years (World Bank 2015). With a Gini coefficient around 34, and an insignificant proportion of population living in extreme poverty, Croatia’s socioeconomic inequalities are fewer than many countries in the region. The percentage of vulnerable minorities (largely Roma) is low, at 0.4% (DZS 2011).
Governance. Croatia, a parliamentary republic with strong local governments, has 21 counties, including the City of Zagreb, and 556 towns and municipalities (DZS 2012). Counties perform activities of regional significance not assigned to bodies of state administration by the constitution and legislation. Towns and municipalities in Croatia represent the lowest level of self-government and perform activities of local significance, including the provision of public services such as water and sanitation (DZS 2012).
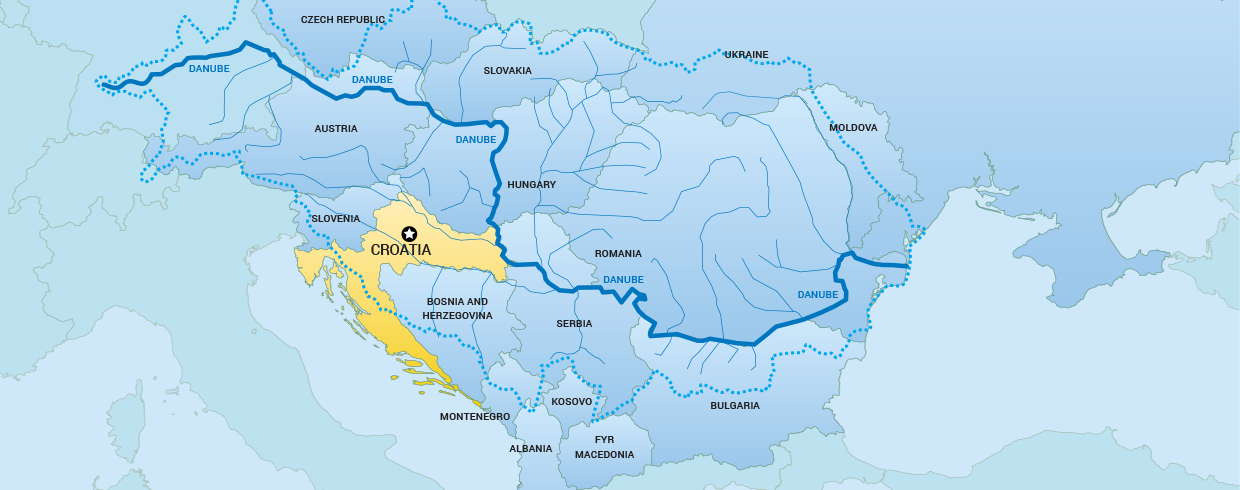
Water resources. Croatia is a water-rich country split between two river basin districts, the Danube basin and the Adriatic basin. With around 24,495 m3 of renewable water per capita per year, Croatia is a water-rich country (FAO Aquastat 2015); surface water quality is, however, a concern, particularly with respect to nutrient pollution in the Danube basin. The entire Danube basin, and limited parts of the Adriatic basin, are classified as “sensitive areas” in the context of the EU Water Framework Directive (EC 2000). In addition, rainfall is highly seasonal, and in the summer some watercourses, especially on the Adriatic side, have significantly decreased runoffs. Heavy seasonal rainfalls can also produce severe flooding, mainly in the southern part of Slavonia. They cause power outages, landslides, and damage to the infrastructure, affecting water and wastewater services and resulting in possible drinking water shortages. Only a small portion of all available resources is actually used, and although climate change is expected to have a negative effect on both water availability and water demand, no specific strategies have been implemented (MZOIP 2003, 2013).
Water supply sources. Water supply comes mainly from groundwater (96%). Surface water provides 4% of overall drinking water supply. Most rivers flow into the Danube or one of its tributaries. The Danube River (coming from Hungary) and the Drava and the Sava Rivers (coming from Slovenia), which are the major tributaries to the Danube, flow through Croatia. The reduction of industrial activity and the decline in the use of fertilizers and pesticides in agriculture have considerably eased the pollution in surface water sources. However, the quality of rivers in the Pannonian watershed is normally lower than desired due to bacterial pollution, with the worst situation encountered in the Sava River. Groundwater resources are abundant and represent about 96% of total drinking water supply (ICPDR 2015). Despite water abundance, there are quantity problems at key localities such as the Adriatic islands, which have poor water resources. The quality of groundwater is generally considered good throughout the country. The reports on the state of the sea and its water quality indicate that a considerable part of the Croatian portion of the Adriatic Sea is oligotrophic and clean, but the ports of big cities and the industrial zones along the coast are at some locations polluted by organic and inorganic substances.
ORGANIZATION FOR SERVICES
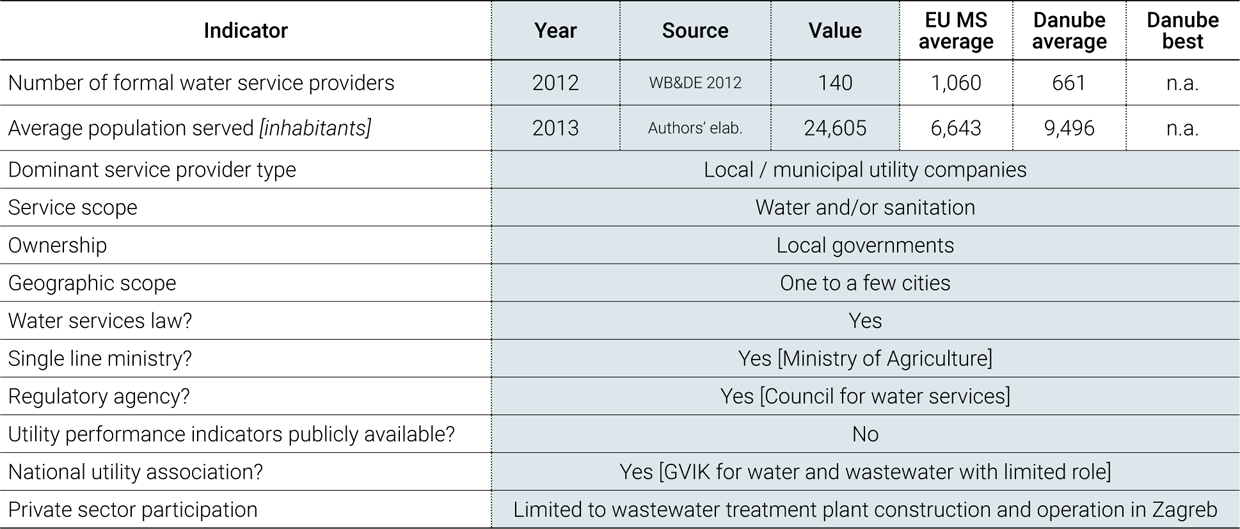
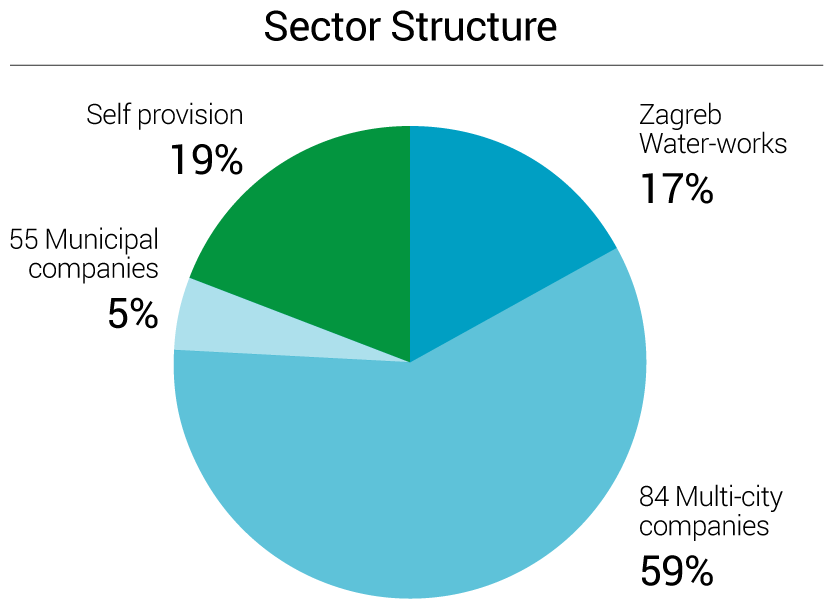
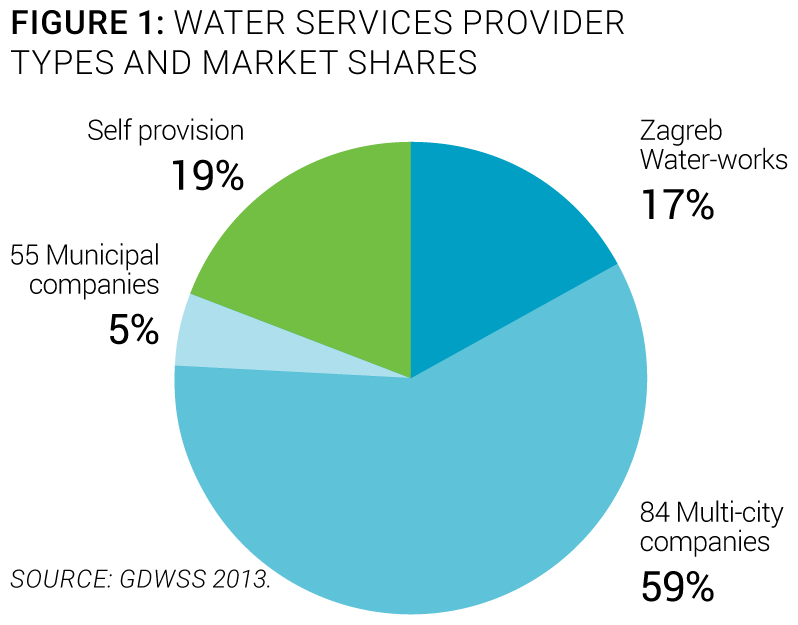 Service provision. Local governments are responsible for water and sanitation services and provide them through 156 public utility companies (140 for water and sanitation service and only 16 for sanitation service). With an average population served of 24,962, the market is dominated by Zagreb Waterworks, servicing about 17% of the population, with a further 84 larger multicity companies servicing 59% of the population. The remaining 24% of the population is either served by 55 small municipal providers (5%) or uses self-provision (19%) or individual water resources (Figure 1). Most utility companies provide both water and sewerage services, although in larger cities, separate utility companies exist (WB&DE 2012).
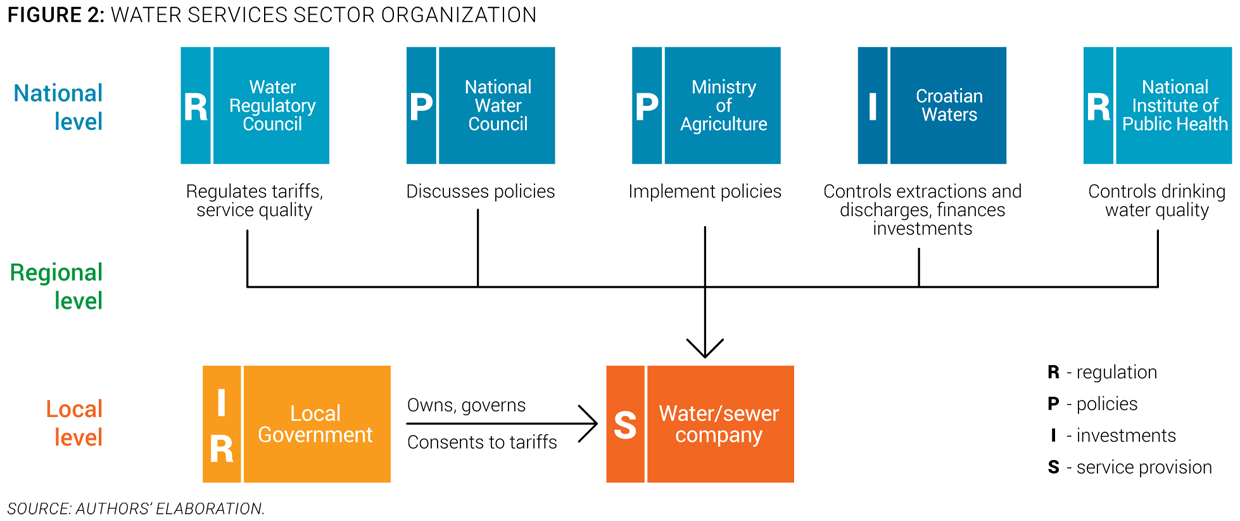
Policy-making and sector institutions. The sector is controlled at the national level. As shown in Figure 2, local service providers are regulated and controlled by a constellation of national-level actors, the most important of which are:
- The National Water Council, which is a group of 10 members representing sector professionals and policy makers and tasked with proposing water policies. National Water Council members are appointed by the Croatian Parliament for four years (WB&DE 2012).
- The Ministry of Agriculture, which is responsible for water policies including those related to water services (WB&DE 2012).
- Croatian Waters, the national water management agency, which grants and controls water extraction and discharge rights, collects corresponding fees, and reinvests the proceeds into sector investments. It is also in charge of flood protection policy. The board running this national agency is appointed by the Government of the Republic of Croatia (WB&DE 2012).
- The Water Services Council, which was established by the 2010 Water Act and which is responsible for economic and service quality regulation. Members of the council are nominated by the government and appointed by the Parliament to a five-year term. The 9 members of the council are experts on water supply and wastewater sewerage, water management, the economy, public finance, or other fields (WB&DE 2012).
- The National Institute of Public Health, which monitors the quality of drinking water (WB&DE 2012).
Capacity and training. Large utilities are key players in staff capacity building. They tend to attract qualified and competent employees with high levels of education. They play a key role in developing staff training and can be considered a driving force for staff capacity enhancement. However, since the water services management staff is appointed by municipal representatives, it is often replaced according to political cycles. Hence, management staff turnover is high, whereas technical staff turnover remains low. To a lesser extent, the national Croatian Water & Wastewater Association, created in 1972, provides training, technical assistance, and knowledge exchange activities (workshops, conferences, journal) to water sector stakeholders.
Economic regulation. Economic regulation is mandated by law, but is still incipient. The 2010 Water Act mandated creation of the Water Services Council, an agency that also serves as the economic regulator exclusively for water and sanitation services (Croatian Parliament 2009; 2011; 2013). The council does not formally license operators, but it reviews and approves any tariff revision before it can be consented to by local governments. Economic regulation is based on the cost recovery principle and a price-cap approach, with a requirement that tariff structures consider subsidy schemes in case an expected water bill is over 2.5% of average household income. The council also monitors service quality and performance through the collection of a series of performance indicators. Despite the well-developed legal and regulatory framework, the council is still in the process of fully deploying its regulatory reach; it has developed instruments for that purpose, including specific by-laws on performance standards, but those have not yet been widely applied. As a result, regulation still needs to be strengthened in terms of human and financial resources, and also by the introduction of a benchmarking platform, currently under development with the assistance of the World Bank.
Ongoing or planned reforms. The 2010 Water Act has initiated a significant sector consolidation and modernization process, which is ongoing. In Croatia, service provision was traditionally a local issue, and the sector was largely atomized. The 2010 Water Act (and a separate Water Financing Act) was passed as part of the country’s harmonization with the European Water Framework Directive and daughter directives, but it also created a legal basis for a significant aggregation process, which should culminate in the more than 150 local utility companies being aggregated into around 20 regional providers, generally along county borders. Water services areas have been established within which the government will recognize only one service provider (Croatian Parliament 2009; 2013). The change is expected to allow more effective European Funds absorption, create cross-subsidies between smaller and larger cities, and further professionalize service providers. The process of merging and aggregating existing providers requires local government consent though, and implementation should start in 2015, with completion by 2016, according to the Government of Croatia. But with the national elections and change of government by the end of 2015, the timeline of implementation sector reform is becoming increasingly uncertain.
ACCESS TO SERVICES
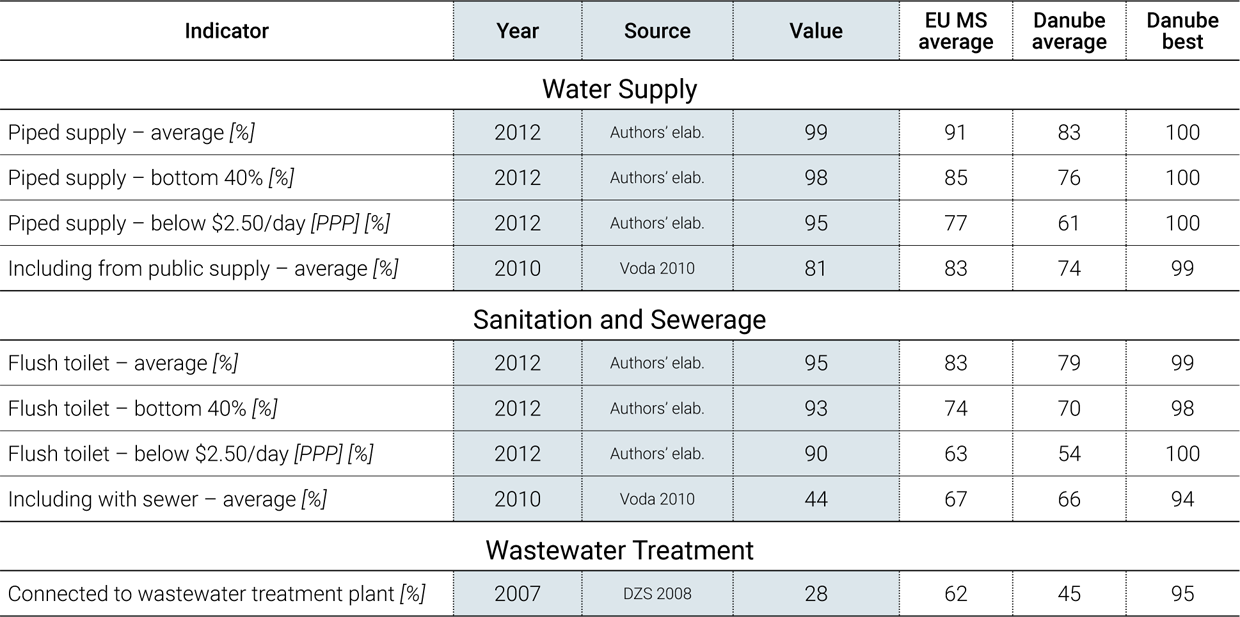
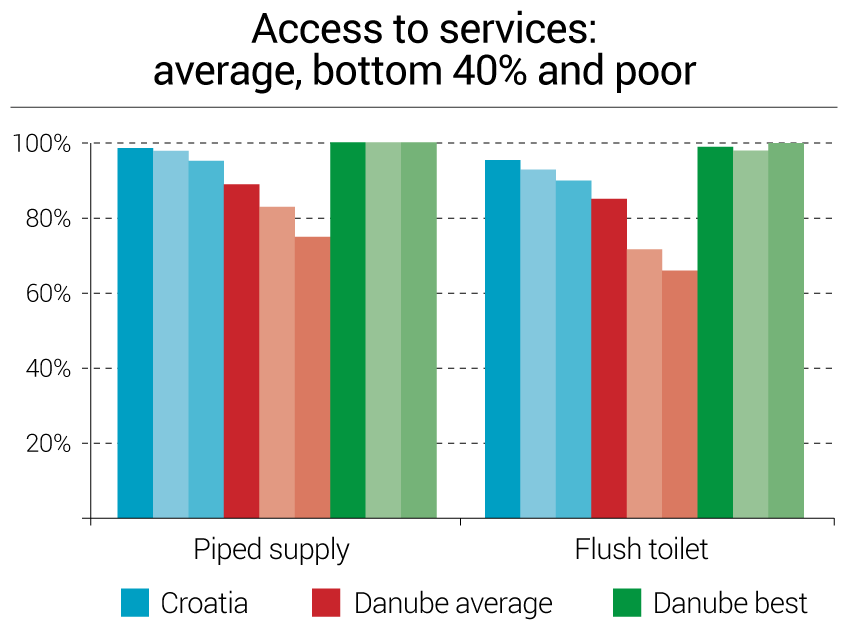
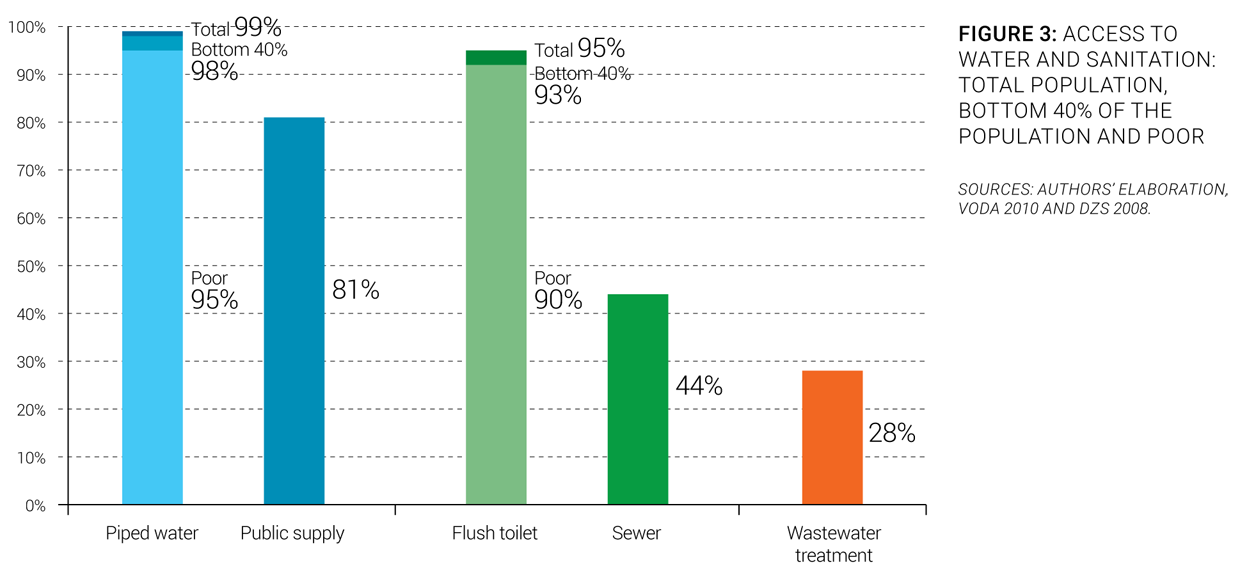
Service coverage. Croatia has traditionally had a high level of service, with near-total access to piped water (99%) and flush toilets (95%). Access to publicly provided services is lower, at 81% for public water supply and 44% for sewerage (Figure 3). Access to wastewater treatment is still much lower but is expected to increase dramatically in the near future based on Croatia’s commitment to implement the EU Urban Wastewater Treatment Directive.
Equity of access to services. Access to water and sanitation by the Roma population needs to be improved. The access rate to water and sanitation facilities for the bottom 40% of the population is high, at 98% and 93%, respectively, and 95% of the poorest share of the population (living on less than $2.50 a day) has access to piped water supply and 90% has access to flush toilets (World Bank 2015). However, according to a UNDP 2011 survey, 35% of the Roma population does not have access to an improved source of water, and 45% does not have access to improved sanitation (UNDP Bratislava 2012).
Service infrastructure. Croatian wastewater infrastructure needs upgrading. The water network, which is 4 times as long as the wastewater network, is aging—most of it was installed more than 50 years ago—and its performance could be improved, since the leakage rate is as much as 40%. Among the 141 wastewater treatment facilities, 46% are equipped with preliminary and primary treatments, 51% with secondary treatment, and only 3% with tertiary treatment. The expected deadline for full implementation of articles 3 through 7 of the Urban Wastewater Treatment Directive is December 31, 2023.
Croatian Data Availability
The Water Services Council, the national regulator, recently started collecting data, but has not yet made it publicly available. Several project-level studies exist, however, which provide a relatively recent, but partial, picture of the sector’s situation.

PERFORMANCE OF SERVICES
Service Quality

Quality of service. Service quality in Croatia is generally very good by regional standards. Water service is continuous, and drinking water quality is mostly in compliance with national and European standards. Although effluent treatment quality is not yet measured in a consolidated manner, most of the wastewater treatment plants are relatively new and can be expected to operate as designed.
Customer satisfaction. The satisfaction of the population with the service provided in their city (per the international Gallup Poll) is correspondingly high, at 82%. This number is significantly higher than in most countries in the region.
Efficiency of Services
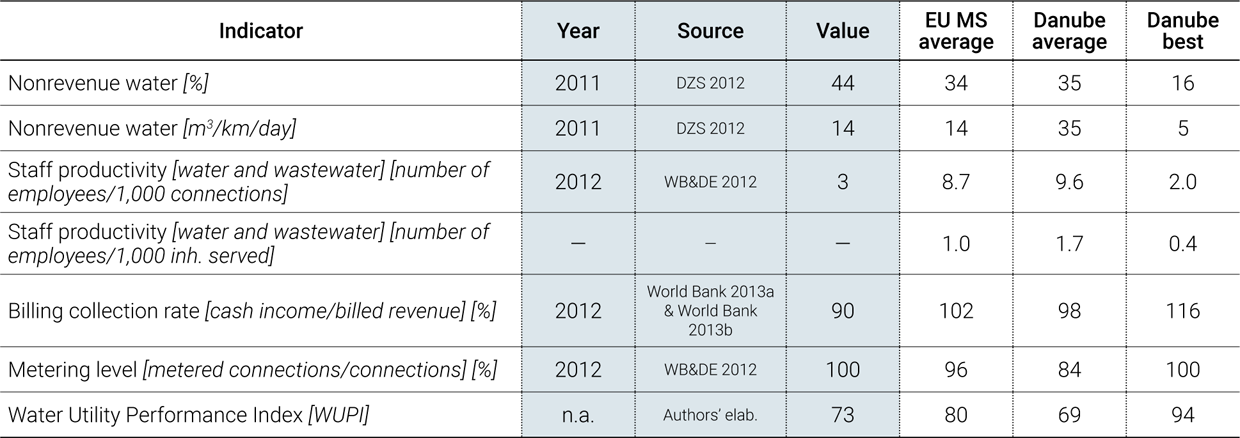
Overall efficiency. The efficiency of public water and sanitation service providers is a remaining issue in Croatia. At 44%, nonrevenue water is much higher than best practices in Western Europe, and driven as much by technical as by apparent losses. Commercial practices are largely sound with universal metering, despite a billing collection ratio of around 90%, on average. With an average of 3 staff per 1,000 connections, the sector is less productive than international best practices of 1 and 2, but more productive than the region overall.
Recent trends. No significant progress has been made on the efficiency agenda over the last 10 years. Most of the indicators mentioned above show no significant improvements, except in the field of collection rate, which appears to have steadily increased, as shown on Figure 4, at least for the limited subset of 10 utilities for which year-by-year data are available.

FINANCING OF SERVICES
Sector Financing

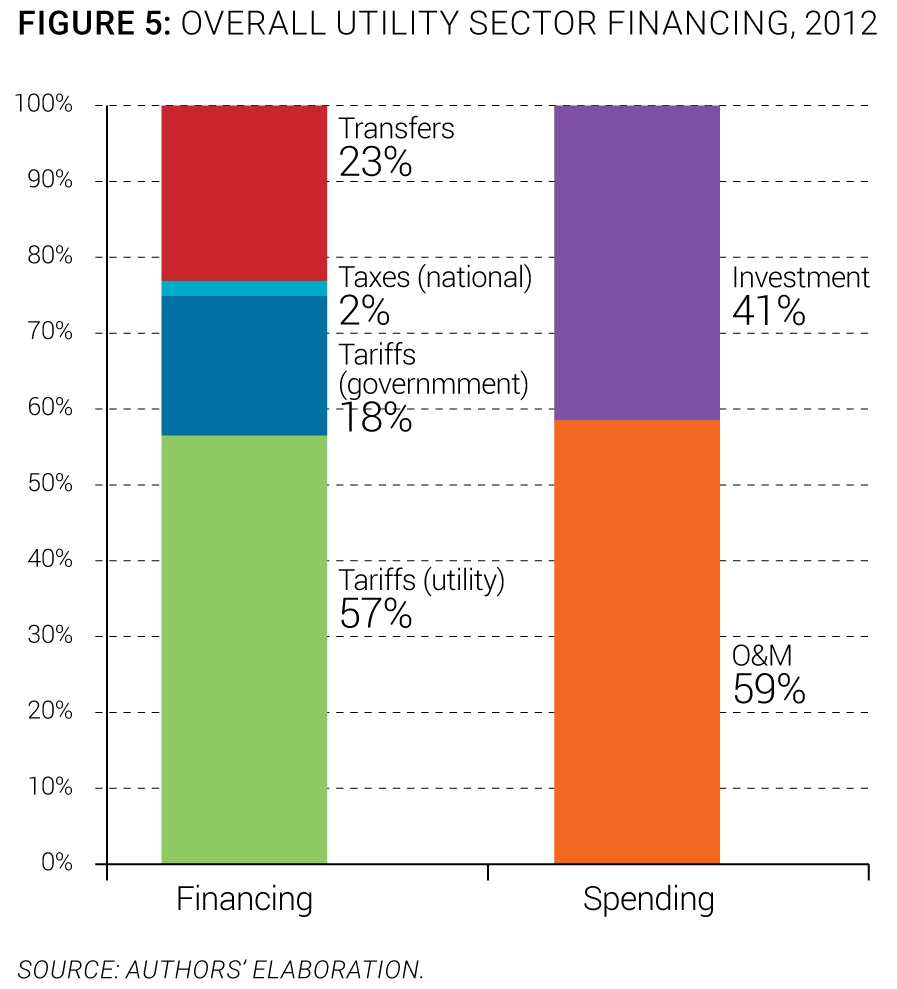
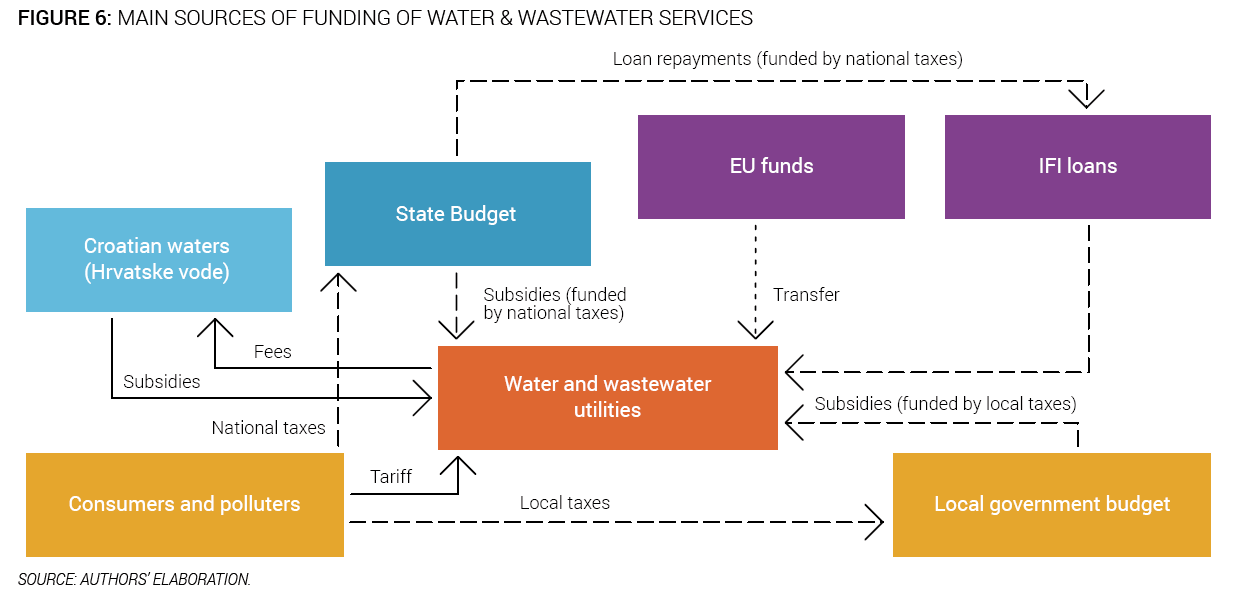
Overall sector financing. Tariffs represent the largest source of financing for the sector. In 2012, water use and water protection fees represented 18% of the sector funding. Tariffs collected by utilities accounted for 57% of the total financing coming into the sector but failed to fully cover O&M utility costs (Figure 5). As a result, funding of investment costs rely on national taxes and transfers. External transfers represent 23% of overall sector financing, and this proportion is expected to rise significantly as EU Cohesion Funds become available to finance necessary EU alignment investments. For illustrative purposes, the standard financing scheme for EU-financed capital expenditures generally include 70% of EU funds, 10% of Croatian Waters funding, and 10% each from national and local budgets. The current proportion between O&M and investments will move further toward investment for the same reason. The main sources of funding of water and wastewater utilities are described in the Figure 6, using the OECD three Ts methodology (tariffs, transfers, and taxes).
Investment needs. Current investment levels are lower than needed to achieve compliance with the EU acquis; they cover only around one-third of the levels necessary to achieve the country’s commitments in terms of meeting the European environmental acquis. EU Cohesion Funds will partly cover the difference, since they usually fund 70% of EU-financed capital expenditures. But tariffs are expected to continue rising in the future to help cover the difference. An estimated €0.85 billion investments are needed to achieve compliance by 2023 with the Drinking Water Directive and another €2.9 billion investments are needed to comply with the Urban Wastewater Treatment Directive.
Investments. Investment levels in the sector are high compared to the region. Around €33 per capita are invested every year. Those investments are financed predominantly from national sources, in addition to which tariffs play a significant role. The largest share (70%) of this investment goes toward wastewater management (sewer extension and wastewater treatment plant construction), which is consistent with the country’s ambitious EU harmonization goals. Investment levels and source and use of funds have not varied dramatically in recent years (Figure 7).

Cost Recovery and Affordability
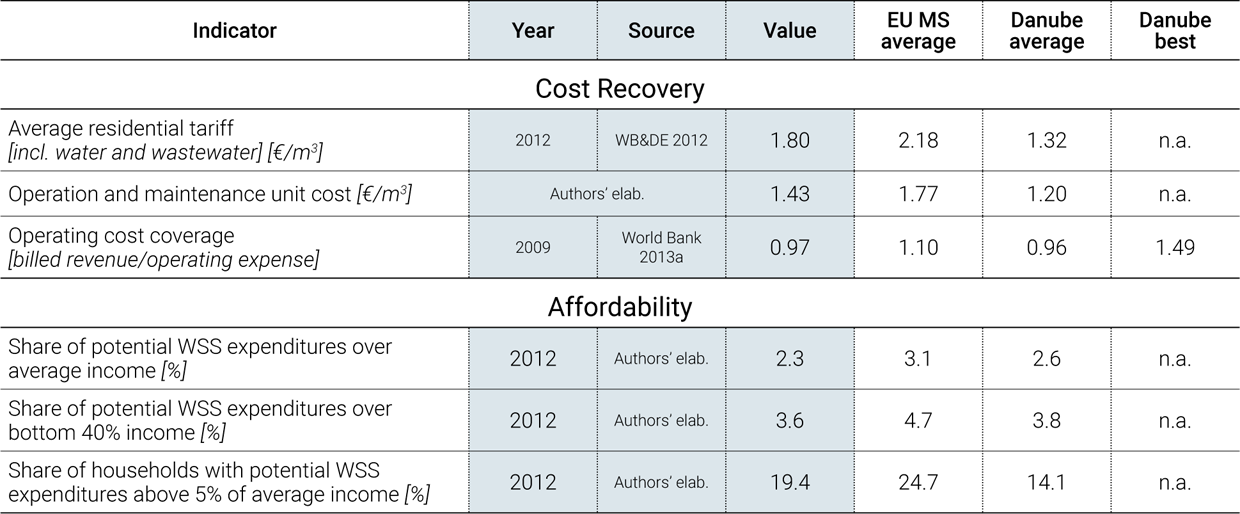
Cost recovery. Seventy percent of services providers in Croatia recover their operational costs from tariffs, and there is no national operational subsidy scheme in place (except for specific cases, such as small islands without local water supply). As shown on Figure 8, however, significant cross-subsidies between residential and industry tariffs exist, with industrial tariffs up to 50% above residential tariffs.
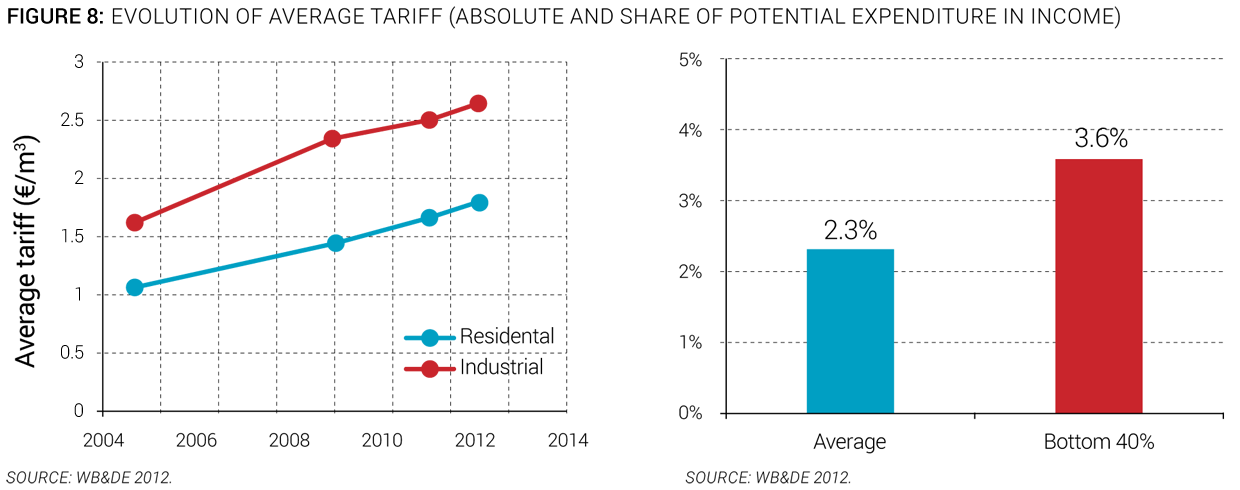
Tariffs. Tariffs have increased and will continue to increase in the near future. Average residential tariffs are higher than the regional average. Tariffs increased an average of 7.5% annually between 2005 and 2012, while average annual inflation was 3% (Figure 8). Tariffs are expected to continue increasing, given the significant investments and subsequent operating costs linked to Croatia meeting the European environmental acquis.
Affordability. Affordability is not a constraint for most people, but might become so for certain segments of the population. In 2012, the potential water bill for an average family was around 2.3% of household income, and 3.6% for the bottom 40%, above the designated Croatian affordability level of 2.5% (Figure 8).
WATER SECTOR SUSTAINABILITY AND MAIN CHALLENGES
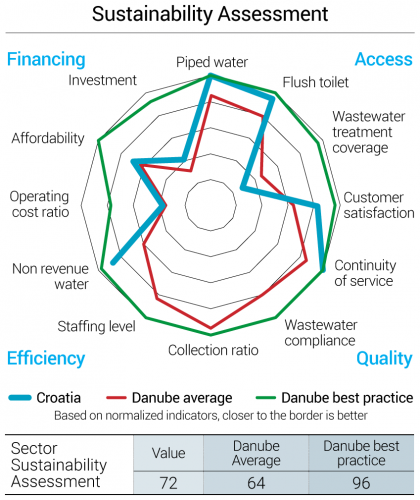
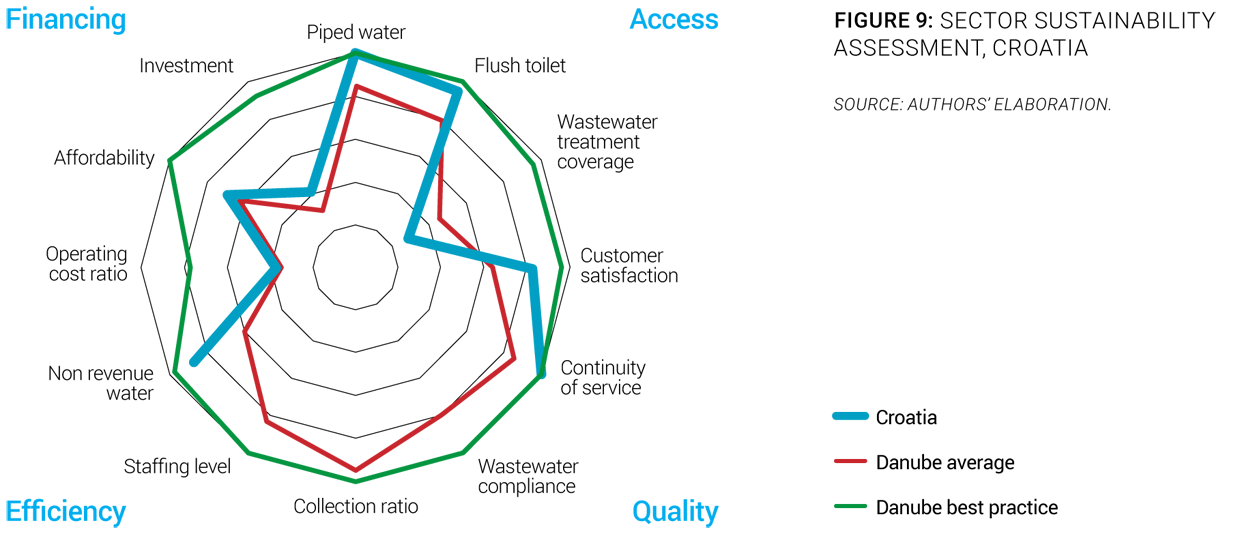
To evaluate and reflect the sustainability of services in the region, an overall sector sustainability assessment was done taking into account four main dimensions: access to services, quality of services, efficiency of services, and financing of services. Each of these dimensions is measured through three simple and objective indicators. For each indicator, best practice values are established by looking at the best performers in the region, and the countries closest to those best performers are deemed to have a more mature sector. A more complete description of the methodology to assess sector sustainability is included in the Annex of the State of the Sector Regional Report from the Danube Water Program. The outcomes of this assessment for the Croatia water sector are displayed in Figure 9, which also shows average and best practices in the Danube region. The Croatian sector sustainability score is 72, which is above the Danube average sustainability of 64. The assessment shows that on average, the country performs well in terms of access to piped water and flush toilets, continuity of service, nonrevenue water and customer satisfaction. The main deficiencies of the Croatia water sector identified through the sector sustainability assessment are the wastewater treatment coverage and the operating cost ratio (Figure 9).
The main sector challenges are:
- Financing compliance with the European Environmental Acquis. As part of its Accession Treaty, Croatia committed to comply with the European water-related directives gradually comply with until 2023. The total cost of this effort is estimated at around € 3.75 billion, requiring almost triple the current levels of investments. In addition to financing challenges (which EU funds might partly alleviate), the implementation capacity of the water utilities, themselves in the midst of an aggregation process, is a limiting factor and it is expected that meeting the commitments of the country will be challenging.
- Ensuring affordability of future tariffs. As shown in this note, the current tariff levels in Croatia are already close to reaching affordability concerns, especially for lower-income households or in more impoverished parts of the country. The construction and operation of the new infrastructure to comply with the environmental acquis, as well as application of cost recovery principle will require substantial tariff increases, which might become unaffordable for the lower-income segment of population. These concerns have been taken into account in the Multi-year Program of Construction of Municipal Water Works (Voda 2014). Appropriate mitigating mechanisms will be needed, in parallel with a renewed effort by the regulator to drive the operators’ performance toward ever more efficient levels.
- Implementing successfully the Aggregation Reform. The government has decided to promote a regionalization process for the current municipal utility companies to aggregate providers into around 20 regional utilities (Uredba o granicama uslužnh područja NN67/14). The main drivers of this effort are the need to absorb EU funds more effectively, and to cross-subsidize the operation of water, and particularly wastewater, systems in smaller settlements, which might find compliance with the new EU standards expensive. The process is an important opportunity for the sector to develop modern, efficient service providers, but this will require particular attention from the Water Services Council (through its regulatory reach) and the line institutions promoting the reform.
- Strengthening regulation in the water sector. The Water Services Council is the economic regulator exclusively for water and sanitation services. Despite the well-developed legal and regulatory framework, the Council is still in the process of fully deploying its regulatory reach. It has developed instruments for that purpose, including specific by-laws on performance standards, but those have not yet been widely applied. As a result, regulation still needs to be strengthened in terms of human and financial resources, and also by the introduction of a benchmarking platform, currently under development with the assistance of the World Bank.
SOURCES
- Croatian Parliament. 2009; 2011; 2013. Water Act (Official Gazette 153/2009, 130/2011, 56/13). Zagreb: Croatian Parliament.
- —. 2009; 2013. Water Management Financing Act (Official Gazette 153/2009, 56/13). Zagreb: Croatian Parliament.
- DZS. 2008. Statistical Yearbook 2008 of the Republic of Croatia. Zagreb: Croatian Bureau of Statistics.
- —. 2011. Census 2011. Zagreb: Croatian Bureau of Statistics.
- —. 2012. Statistical Yearbook 2012 of the Republic of Croatia. Zagreb: Croatian Bureau of Statistics.
- —. 2013. Statistical Yearbook 2013 of the Republic of Croatia. Zagreb: Croatian Bureau of Statistics.
- EC. 2000. EU Water Framwork Directive (200/60/EC). Brussel: European Commission.
- FAO Aquastat. 2015. Food and Agriculture Organization of the United Nations - AQUASTAT Database. Accessed 2015. http://www.fao.org/nr/water/aquastat/data/query/index.html?lang=en.
- Gallup. 2013. World Poll. Accessed 2015. http://www.gallup.com/services/170945/world-poll.aspx.
- HZJZ. 2013. Croatian Health Service Yearbook. Zagreb: Croatian National Institute of Public Health.
- ICPDR. 2015. International Commission for the Protection of the Danube River. Accessed 2015. http://www.icpdr.org.
- MZOIP. 2003. State of the Environment Report - Republic of Croatia 2003. Zagreb: Ministry of Environmental and Nature Protection of the Republic of Croatia.
- —. 2013. River Basin Management Plan 2013 - 2015. Zagreb: Ministry of Environmental and Nature Protection of the Republic of Croatia.
- UNDP Bratislava. 2012. UNDP/World Bank/EC Regional Roma Survey 2011. Bratislava: United Nations Development Programme Bratislava Regional Centre.
- Voda. 2010. Implementation Plan for Water Utility Directives. Zagreb: Croatian Waters.
- —. 2012. Annual Plan of Croatian Waters. Zagreb: Croatian Waters.
- —. 2014. Multi-year Program of Construction of Municipal Water Works 2014-2023 - Draft. Zagreb: Croatian Waters.
- WB&DE. 2012. Study on Institutional Options in the Water Supply and Waste Water Sector. Zagreb: Witteveen+Bos and Dvokut ECRO.
- World Bank. 2013a. Implementation Completion and Result Report (IBRD-72260 TF-54882), on a Loan for a Coastal Cities Pollution Control Project. Utility Performance Information, Washington, DC: World Bank.
- —. 2013b. Implementation Completion and Result Report (IBRD-74530), on a Loan for an Inland Waters Project. Utility Performance Information, Washington, DC: World Bank.
- —. 2015. World Development Indicators. Accessed 2015. http://databank.worldbank.org/data/views/reports/tableview.aspx.