 ROMania
- Water Snapshot
- Context for Services
- Organization for Services
- Access to Services
- Performance of Services
- Financing of Services
- Water Sector Sustainability and Main Challenges
- Sources
WATER SNAPSHOT
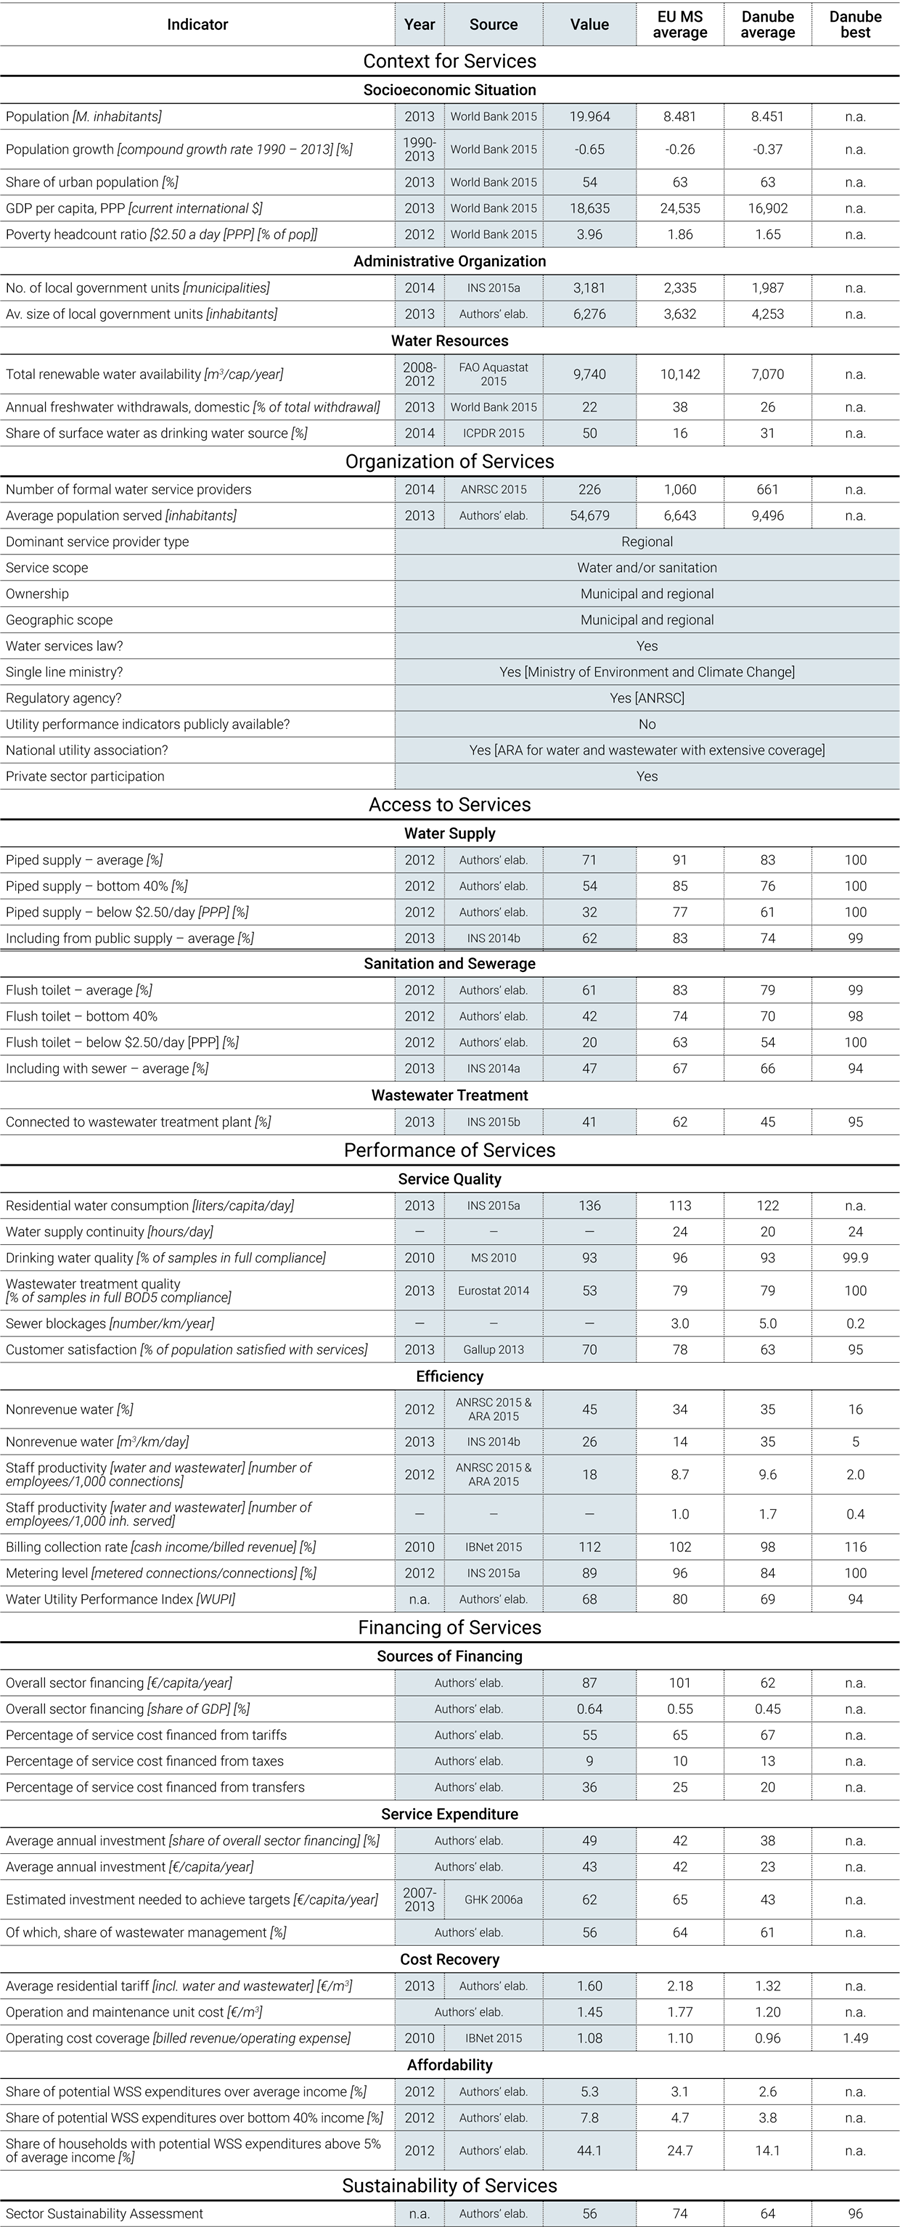
Sources for all numbers in the snapshot are provided in full in the body of this country page; a complete description of the methodology is provided in the State of the Sector Regional Report available under SoS.danubis.org/Report.
 |
 |
KEY WATER AND SANITATION SECTOR CHALLENGES
- Improving access to water and sanitation in rural areas. With a low rate of rural population having access to piped water (29%) and flush toilets (10%) (UNECE/WHO 2010), improving access to water and sanitation in rural areas is a key challenge for Romania. Completion of the regionalization of water services, as stated in the Sector Operational Programme, could help improve the quality of and access to water and wastewater infrastructure for the unserved population, especially in rural areas.
- Strengthening the capacity of operators to ensure implementation of investment projects. The capacity-strengthening scheme included in the Sector Operational Programme is designed to provide support to local authorities to implement an integrated multiyear capital investment program in order to improve the standards of municipal water and wastewater services. This is a key element to ensure that the €15 billion in investments required to comply with all EU acquis requirements are effectively implemented by 2027.
- Addressing affordability issues regarding water and sanitation prices. Affordability of water is potentially an issue for a majority of the Romanian population, with the average share of potential water and sanitation expenditures at more than 5%. The upcoming investment efforts could exacerbate the affordability issue in the future.
- Improving efficiency of water services. The regionalization of water services was designed and planned to overcome excessive sector fragmentation and to achieve economies of scale. Now that the process is complete, water providers can focus on improving the efficiency of their utilities by reducing nonrevenue water and staffing levels which are considered high in comparison with other countries in the region, by increasing the metering level.
FURTHER RESOURCES
On water services in the Danube Region
- A regional report analyzing the State of Sector in the region, as well as detailed country notes for15 additional countries, are available under SoS.danubis.org
- Detailed utility performance data is accessible, if available, under www.danubis.org/database
On water services in Romania
The following documents are recommended for further reading; the documents, and more, are available at www.danubis.org/eng/country-resources/romania/
- ANRSC. 2012. Annual Report of the National Regulation Agency for Public Services for Water. Bucharest: National Regulation Agency for Public Services of Romania.
- MMediu. 2012. Sectoral Operational Programme Environment 2007 - 2013. Bucharest: Ministry of Environment and Forests of Romania.
CONTEXT FOR SERVICES

Economy. Romania, which joined the EU in January 2007, is considered an upper-middle-income country, with a per capita GDP of $18,635. Domestic consumption and investment fueled strong GDP growth, but led to large current account imbalances. Romania’s macroeconomic gains have only recently started to spur creation of a middle class and to address Romania’s widespread poverty. Among the 20 million inhabitants, 54% live in urban areas and 3.3% belong to the Roma minority (ANR 2015). Economic growth accelerated in 2013, driven by strong industrial exports and an excellent agricultural harvest. Inflation dropped to a historically low annual rate of 1.6% (INS 2015a), and the current account deficit was reduced substantially. Yet, progress on structural reforms is uneven, and the economy is still vulnerable to shocks.
Governance. Romania is a unitary republic divided into 42 counties plus the municipality of Bucharest. Each county is administered by a county council, which is responsible for local affairs, and by a prefect, who is appointed by the central government and who is in charge of national affairs administration at the county level. Each county is further subdivided into cities and communes, with a mayor and a local council. There are 2,861 communes and 320 cities, among which 103 have the status of municipality (INS 2013), which gives them greater administrative power over local affairs. The municipality of Bucharest is a special case, since it enjoys county status. Local self-governments are in charge of organizing, providing, and controlling local public services, among which is water and sanitation services provision.
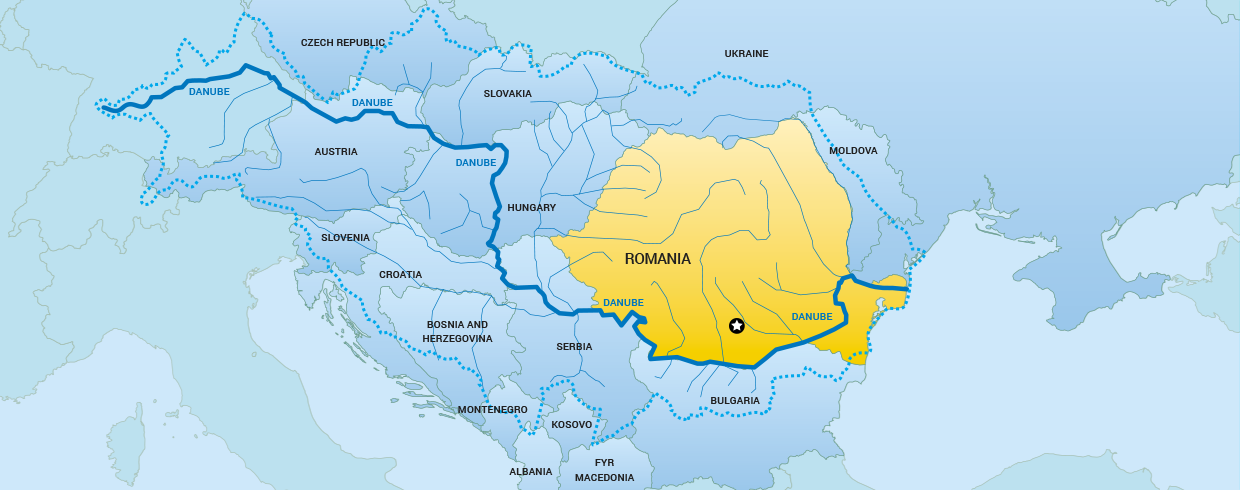
Water resources. Romania has limited water resources. The Romanian territory is almost entirely (97.8%) included in the Danube River basin, and represents 30% of the total surface of the Danube basin. The Danube Delta, which covers 4,178 km2 (82% in Romania), is the country’s most important protected area, and since 1990 it has been part of UNESCO’s Man and Biosphere Programme and has been included as a Ramsar and World Heritage site. But at 2,119 m3/inhabitant/year, Romania is poor in water resources, which comprise the Danube (44%) and inland rivers (46%), representing a network of 78,905 km; and groundwater (10%). Water resources are unevenly distributed throughout the country, with large seasonal and year-to-year variations.
Many Romanian inland rivers, particularly those from mountain areas, remain undisturbed by anthropogenic pressure (57% of water bodies) and are of high ecological value. However, economic development between 1960 and 1989 resulted in a significant worsening of the water quality of the Danube and inland rivers. Since then, water quality has improved due to a decrease in economic activity and new regulations based on the “polluter pays” principle.
Surface and ground waters are regularly monitored, but the monitoring results are not always reliable, since laboratory equipment is often obsolete. Annual average rainfalls vary from over 750 mm in the highest western mountains to 600 mm in the region of Bucharest (ICPDR 2006). Major floods occur in spring, followed by prolonged droughts due to high variability of rainfalls, increased urban land use, ad-hoc development in flood plains, and reduced river bed capacity. Climate change is expected to cause an increase in temperature and a decrease in annual precipitation and water flow at the national level, and more intense flood and drought episodes. A Climate Change Strategy has been adopted for 2013-2020.
Water supply sources. Drinking water supply relies mainly on surface waters, which are vulnerable to pollution. Water demand of households, industry, and agriculture has decreased considerably from 20.4 billion m3 in 1990 to 6.49 billion m3 in 2012 due to a reduction in industrial activity and in water losses, and due to water-thrifty technological processes. The water abstracted is used first to supply industries (4.35 billion m3), then agricultural needs (1.09 billion m3) and domestic demand (1.05 billion m3). Drinking water is predominantly supplied from surface waters (62%), which require treatment, unlike groundwater (ANAR 2012). Waters are polluted with nitrates coming mainly from agriculture, phosphorus, and organic waste load coming mainly from household wastewater discharge.
ORGANIZATION FOR SERVICES
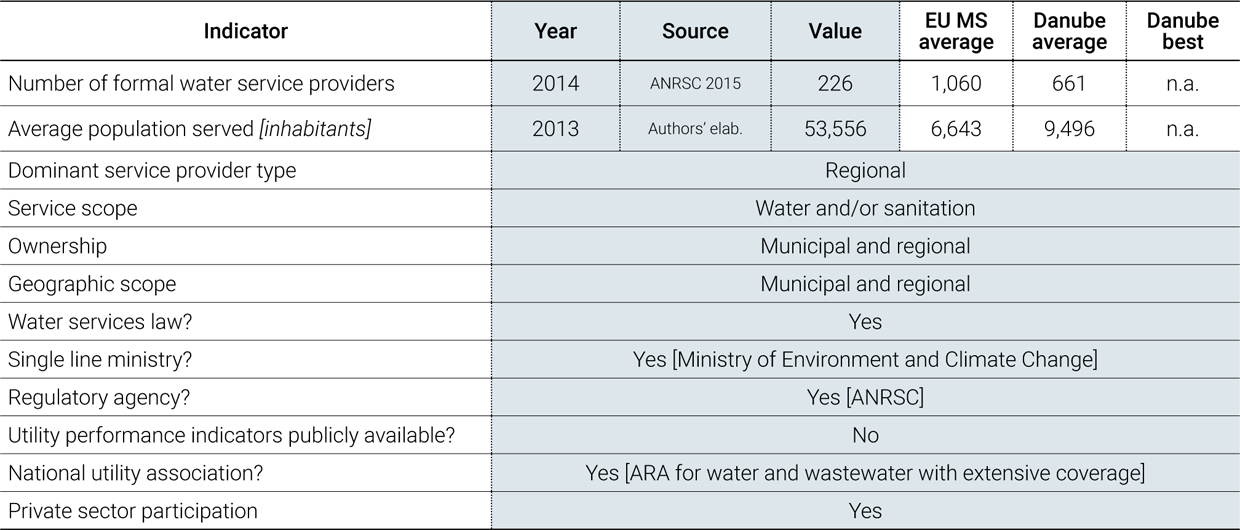
Service provision. Local authorities provide water and sanitation services through 226 utilities. Forty-two large regional water utilities provide water and sanitation services to 44% of the population (Figure 1). These large regional operators, called Regional Operating Companies (ROCs), are the public service operators of the Inter-communal Development Associations (IDAs), whose members are local authorities (municipalities and communities). Two large municipal utilities (including Bucharest), covering 9% of the population, have delegated management of their water and sanitation services to private operators for a period of 25 years. Another 182 local municipal services supply 9% of the population. Other inhabitants rely on self-provision (38%).
The regionalization, which reorganized the existing public services owned by municipalities, is based on three key institutional elements: the Intercommunity Development Association (IDA), the Regional Operating Company (ROC), and the Contract of Delegation of Services’ Management (Figure 2). The IDA is the sole interlocutor of the ROC, representing the common interests of its member municipalities regarding water and wastewater services, especially with regard to general strategy, investments, and tariff policy. The ROC is a commercial company, owned by the IDA member municipalities, to which the management of the water and wastewater service is delegated through the Delegation Contract. The ROC is thus appointed to manage, operate, maintain, upgrade, renew, and expand, where appropriate, all the public assets designated in the contract. It collects the invoices paid by customers, in accordance with the provisions of the contract.

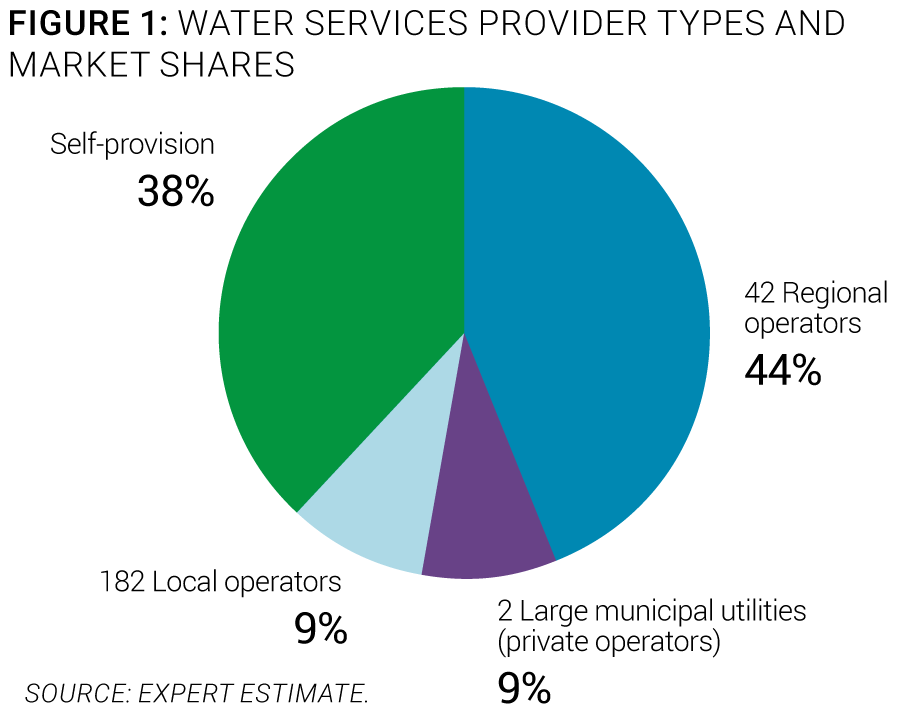
Policy-making and sector institutions. The water sector is controlled by national and river basin institutions with a clear line ministry (Figure 3), and comprise:
- The Ministry of Environment and Spatial Planning, which is the line ministry responsible for water sector policy development and implementation. It is in charge of regulatory benchmarking, and finances investments and manages EU Cohesion Funds (MOP 2015a).
- The Ministry of Environment and Sustainable Development, which is the line ministry responsible for the development of water management policies and strategies, and for the coordination with EU integration for water-related topics. It also prepares water-specific regulations.
- The National Administration “Romanian Waters”, which comprises 11 river basin authorities under the authority of the Ministry of Environment and Sustainable Development. They are responsible for implementing national policies and strategies related to the qualitative and quantitative management of water resources.
- The National Regulation Agency for Public Services, which was established by law in 2006, is responsible for the regulation of public services such as transport, lighting, waste, and water. It develops secondary binding regulations especially for tariff setting. It also issues licenses and permits and has control over water service quality. It operates under the umbrella of the Ministry of Regional Development and Public Administration.
- The Ministry of Health, which is responsible for monitoring drinking water quality.
Capacity and training. Despite some important efforts, staff capacity building and training still need to be improved further. The Romanian Water Association provides technical assistance and knowledge exchange activities (workshops, conferences, journal) to water sector stakeholders. It recently established a Water Training Centre (CFPPDA) that organizes training courses and seminars designed for the specific needs of water professionals and that provides water-sector-related information and documentation. In addition, international groups (Veolia) that are involved in the Romanian water sector also play an important role in developing staff training for all levels of managers through well-established human resources principles. In regional utilities operated under the supervision of local authorities, water services management staff is appointed by locally elected politicians. Staff is often replaced according to political cycles, and thus management staff turnover is relatively high. As a consequence, water sector staff training and capacity can be improved.
Economic regulation. The economic regulation of the water sector is overseen by a national regulation agency. The National Regulation Agency for Public Services (ANRSC) is the formal national regulator for water and sanitation, energy, district heating, public lighting, and local public transport activities. It is in charge of tariff setting and reviewing for the water sector, and for addressing customer complaints. For instance, in 2012, ANRSC received 189 complaints related to water (ANRSC 2012). Tariffs are reviewed upon utility request according to a revenue cap methodology.
There are three steps in the price review process. First, the operator prepares documentation supporting its price proposal, in accordance with official requirements. Second, the ANRSC checks the compliance of the procedure and calculation method to determine the new proposed tariff. Third, once the operator gets ANRSC approval, the new water price must be formally approved by the local authorities. In 2013, ANRSC was responsible for monitoring and controlling 2,558 operators providing 2,918 public services.
Ongoing or planned reforms. The regionalization of water operators is ongoing, with the objective to achieve economies of scale and efficiency gains. The regionalization of water services was designed and planned to overcome excessive sector fragmentation and to achieve economies of scale. From an institutional perspective, the regionalization was performed through the reorganization of existing public services owned by municipalities. This process consisted of the concentration of the operation of services provided to a group of municipalities within a geographic area defined with respect to a river basin and/or an administrative boundary (municipality, county). The objective was to create about 50 large operators by merging the existing local utilities into Regional Operating Companies (ROCs). To date, 42 ROCs have been created under the regionalization strategy, which was part of the Sector Operational Programme 2007-2013.
ACCESS TO SERVICES
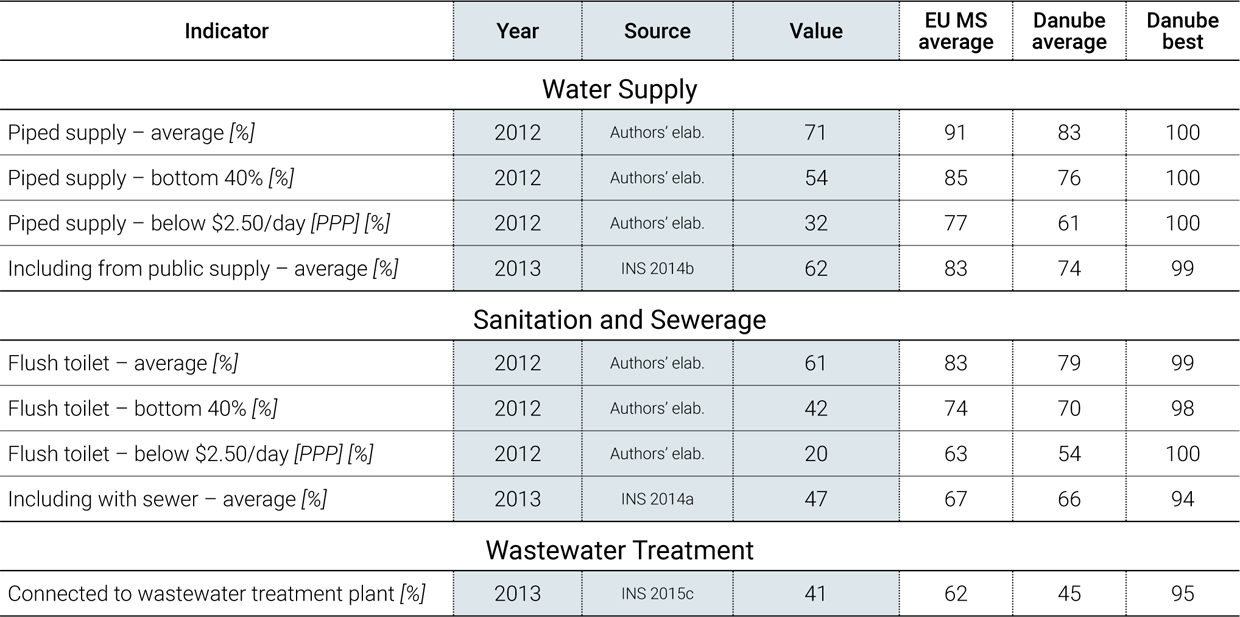
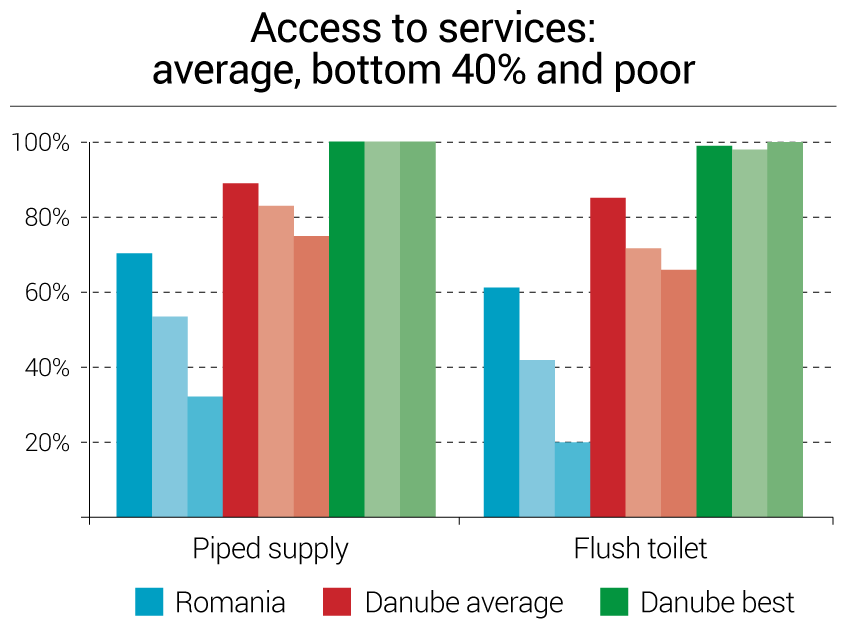
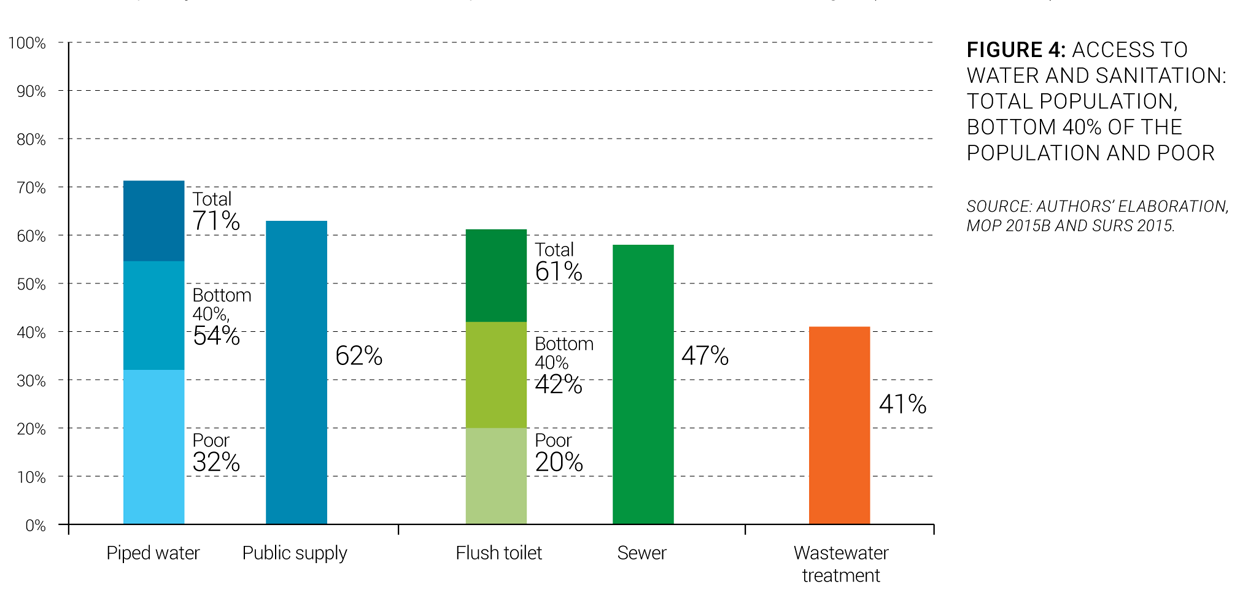
Service coverage. Only about two-thirds of the population have access to piped water supply and flush toilets. Seventy-one percent of the population has access to piped water in Romania (Figure 4) and 61% to flush toilets, much below regional averages. These low levels can be largely explained by the significant rural population in Romania, as access to piped water ranges from 91% in urban areas to 29% in rural areas. About 47% of the population is connected to sewerage systems and 41% to wastewater treatment facilities. Those rates have steadily increased since Romania became an EU Member State.
National Roma Inclusion Strategy
The National Agency for Roma coordinates with other line ministries the implementation of programs aimed at improving the living conditions of the Roma. These programs are reflected in the “Roma Inclusion Decade” and the new National Roma Inclusion Strategy (NRIS) 2013-2020.
Equity of access to services. The situation of the poorest share of the population and of the Roma minority is particularly critical. Only 32% of the poorest share of the population (those living on less than $2.50 a day) has access to piped water, and 20% to flush toilets. According to a UNDP survey (UNDP/World Bank/EC 2011), 72% of the Roma population does not have access to an improved water source and 83% does not have access to improved sanitation. Taking stock of that situation in a 2013 report, the Romanian Ministry of Labour, Social Protection, Family and the Elderly has identified cost-effective programs to promote the integration of Roma, providing diagnostics in key areas of poverty and social safety nets, employment, education, housing and habitat upgrading, and health. This report combines quantitative and qualitative evidence, and outlines a set of policy measures to improve the Roma situation. The purpose of this study was to inform policy makers and recommend options for solutions to these challenges (World Bank 2014).
Service infrastructure. Water and wastewater infrastructure need to be upgraded, rebuilt, and developed. The distribution networks are in very poor condition, which leads to organoleptic changes in the quality of distributed water. However, the water supply network is continuously expanding in rural areas; it was lengthened by 25% between 2000 and 2005. Of the water treatment plants and storage installations (both municipal and industrial) inspected in 2005, 40% performed adequately and 60% did not. Wastewater treatment plants are in such poor condition due to obsolete infrastructure (old wastewater pipes), modifications of their treatment capacity inconsistent with initial design parameters, low capacity of management staff, and the poor financial situation of local services operators. In addition, the water sector uses huge amounts of energy—sometimes up to 40% of the operational costs—as do other countries in the region.

PERFORMANCE OF SERVICES
Service Quality

Quality of service. Overall quality of service is good but could still be improved. Average water consumption per capita per day is 136 liters, which is in line with the mean consumption in the Danube region. From 2006 to 2012, average consumption rose by 12.6%, while overall water abstraction decreased by 30%, mainly due to a drop in industrial water use. The quality of distributed water is generally good, but drinking water sometimes fails to meet chemical standards due to chlorure and iron (7%), and to microbiologic requirements due to coliforms (1.5%). Overall continuity of service is considered good, although a few water utilities can be affected by intermittent water supply due to an insufficient level of flow regularization on water streams or significant pollution of some inland rivers.
Customer satisfaction. Customer satisfaction with the service provided in their city is low, at 70% (Gallup 2013). This percentage is slightly lower than in most countries in the region.
Efficiency of Services
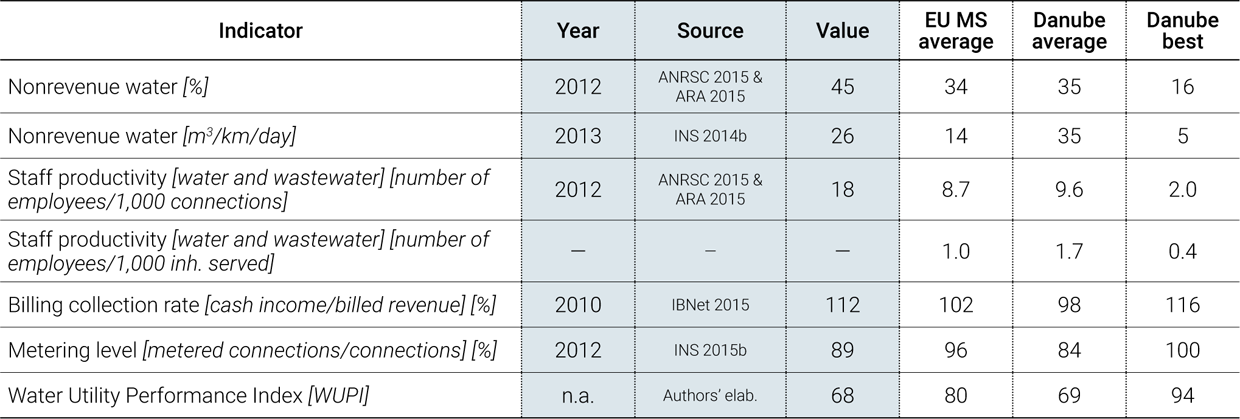
Overall efficiency. More efficiency efforts are still required. Efficiency gains and utility performance are among the objectives assigned to ROCs providing water and sanitation services under the Sector Operational Programme 2007-2013. However, overstaffing remains an important issue in most water utilities, where average staff productivity is 18 compared to international best practice of 1 to 2 (Figure 5). At 45%, the nonrevenue water rate is high compared to best practices, but is in line with the Danube regional average. On the positive side, the average bill collection rate is 112%, which shows good capacity to recover both past-due bills and current billed invoices. Thus, utilities demonstrate the ability to generate revenues. In addition, the metering level has steadily increased, and was 89% in 2012.
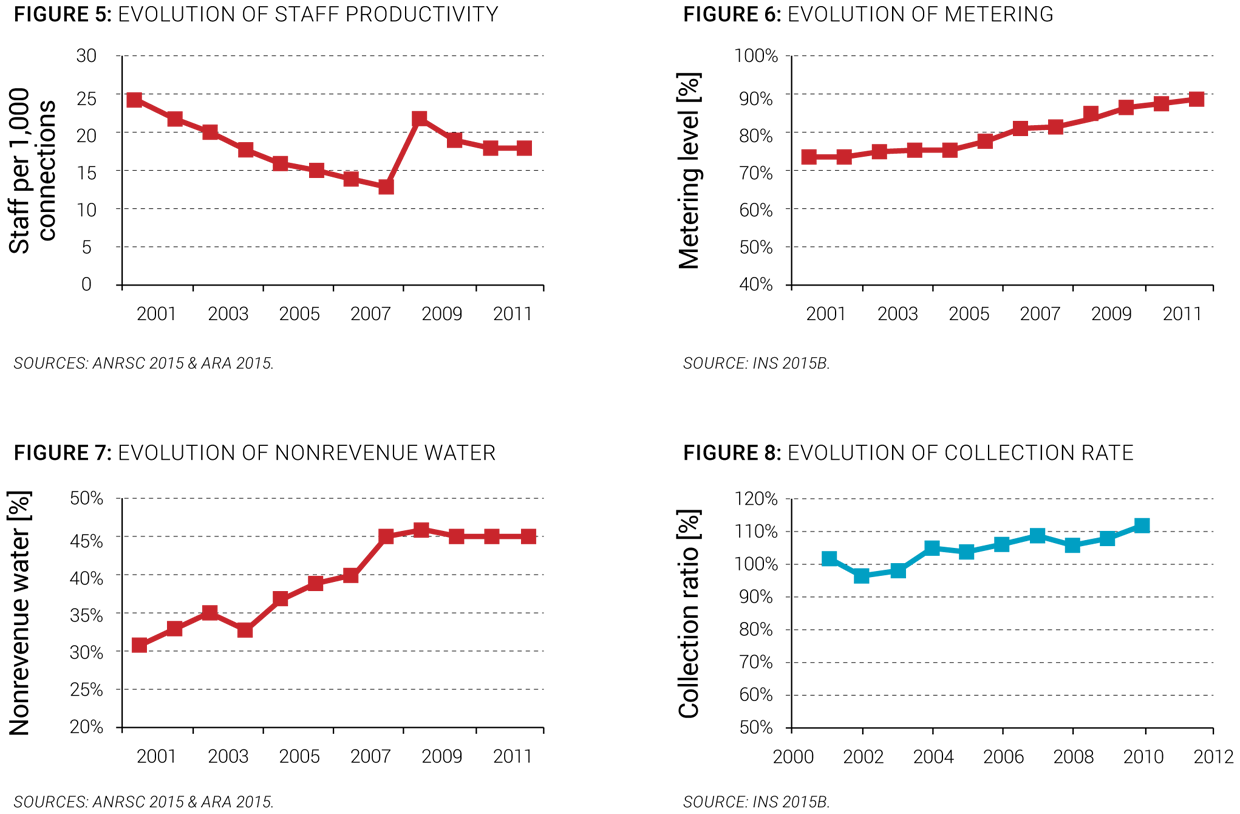
Recent trends. No real efficiency gains have been made. Over the last 10 years, the level of nonrevenue water has reached 45% (Figure 7). The reasons for this are that metering improvement (Figure 6) has led to a more accurate measurement of leakage and nonregistered connections; there is insufficient maintenance of the water network and insufficient investments in the system; and, since 2008, the accuracy of data collection has improved with the establishment of a validation process (Figure 8). Due to the regionalization process, the length of water network per service increased, while the number of employees remained stable. As a result, staff productivity increased. However, in 2008, data collection accuracy was improved, which resulted in a decrease in staff productivity.
FINANCING OF SERVICES
Sector Financing
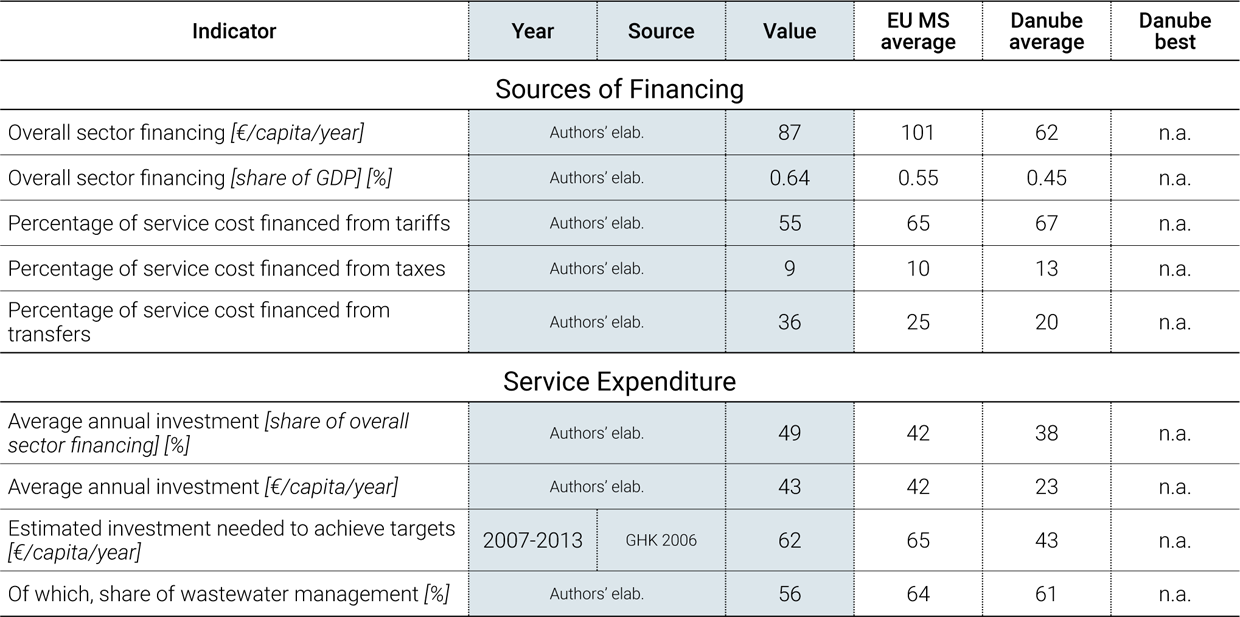

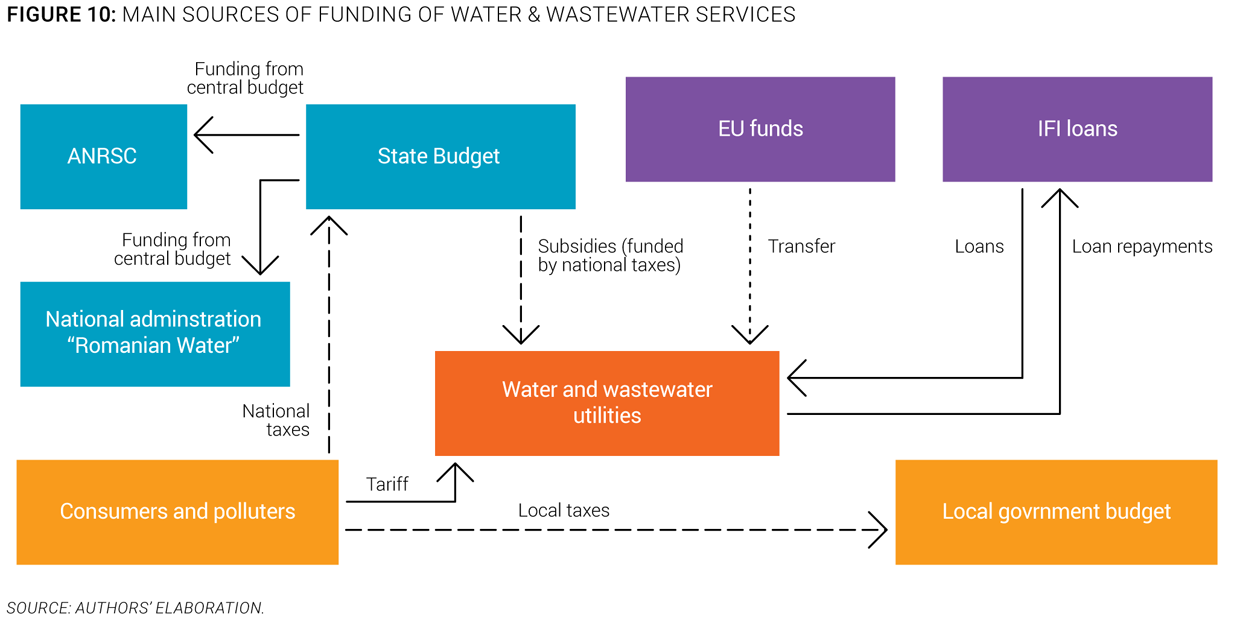
Overall sector financing. Tariffs cover operation and maintenance costs. Moreover, tariffs represent more than half of sector funding sources. Water and sanitation utilities largely rely on transfers to fund their investments, which represent 49% of the overall costs of the sector (Figure 9). The main sources of funding of water and wastewater utilities are described in the Figure 10, using the OECD three Ts methodology (tariffs, transfers, and taxes).
Investment needs. Annual investment effort per capita would need to increase by 38% for the next 13 years. To comply with all EU acquis requirements relating to the water and wastewater sector (the Urban Wastewater Treatment Directive, the Drinking Water Directive, and the Water Framework Directive), Romania would have to invest about €15 billion by 2027, or €62 per capita per year.
Investments. Annual investment per capita is high, at €43. Romania has set ambitious investment targets for the water and wastewater sector in its Sector Operational Programme for Environment for 2007-2013. To meet EU accession and Directive No. 91/271/EC requirements on urban wastewater treatment by the end of 2018, Romania must invest about €9.5 billion—€5.7 billion for wastewater treatment and €3.8 billion for sewerage systems. An additional €3.8 billion is needed in investments in the water network and plants. As of 2013, €5.5 billion has been invested in water and sewerage infrastructure improvement and development, which represents 2.8% of annual GDP and €43 per capita per year. Only 58% of planned investments funded by EU grants have effectively been implemented on the ground. This underscores the challenge of EU funds absorption in the Romanian water sector.
Cost Recovery and Affordability
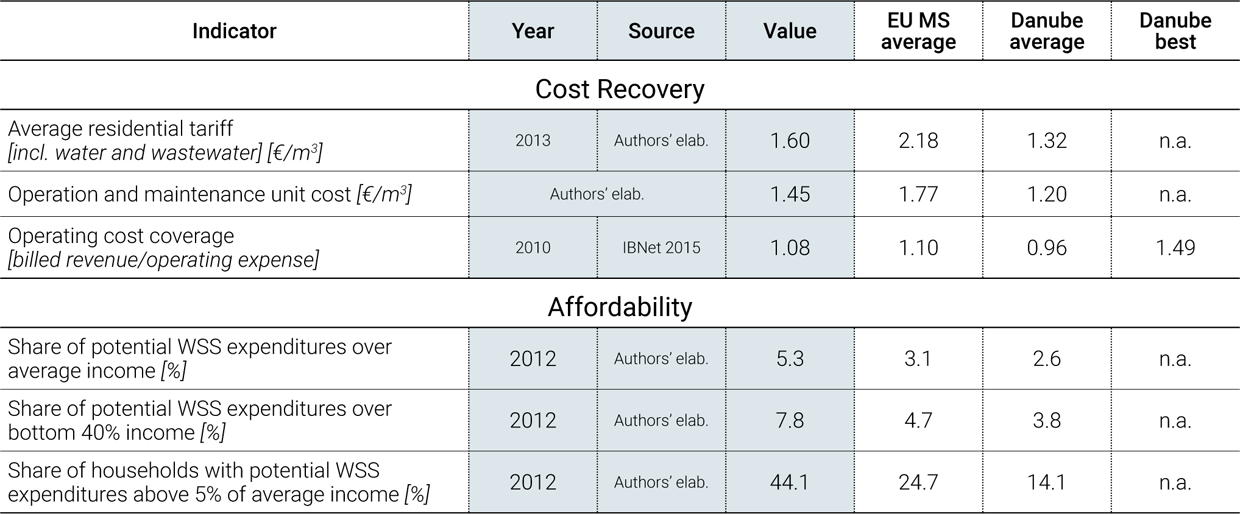
Cost recovery. Water and sanitation utilities revenues cover only their operation and maintenance costs. The average operating ratio of water utilities in Romania is 1.08, which has remained stable since 2009. Tariffs do not generate enough revenues to cover capital expenditure. More than 70% of capital expenditure is funded by EU funds and international financial institution loans. Investment funding is augmented by national budget funds on a first come-first served basis.
Tariffs. Water and sanitation tariffs increased dramatically during the last decade. Between 2008 and 2013, average water and sewerage tariffs rose from €0.71 to €1.60 per m3, an increase of 124% (Figure 11), while average annual inflation was 5.4%. Tariffs are expected to continue to rise due to the increasing investments and operating costs necessary to satisfy EU environmental acquis requirements.
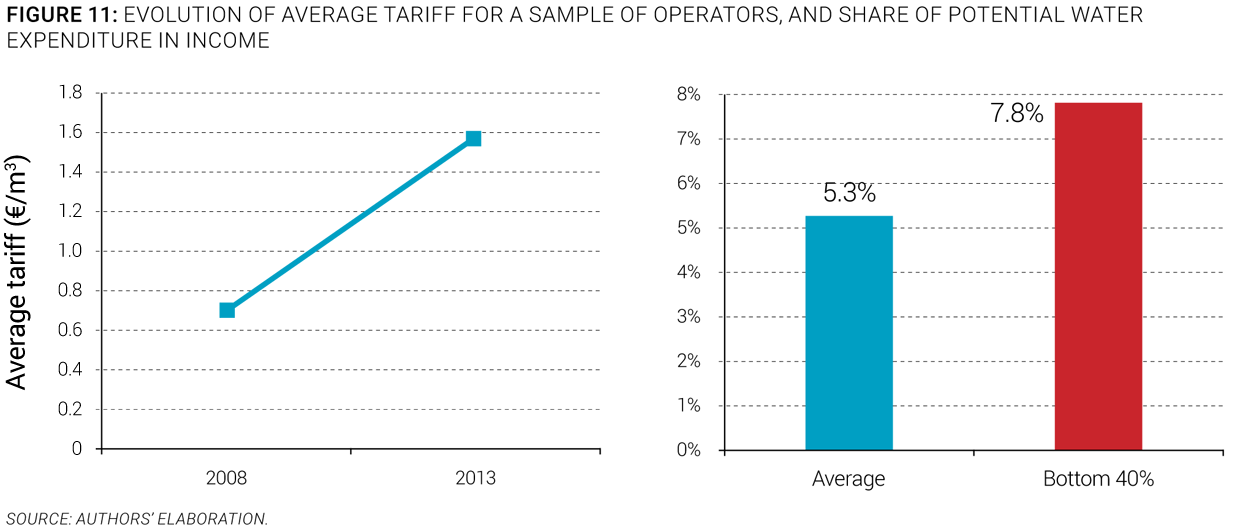
Affordability. Affordability of water tariffs is already an issue for the majority of the Romanian population. The potential cost of water and sanitation consumes up to 5.3% of the average household income of those connected to a public water and wastewater service. This percentage ranges from 8.3% for rural households to 6.4% for urban households. The potential cost for the few poorest households connected to public water and sanitation service consumes close to 14% of average household income.
Benchmarking, Financial & Operational Perfomance Improvement Programme
The overall objective of the project is to assist the newly formed Regional Operating Companies in Romania in their transition through improved benchmarking and performance support. To do that, the programme will develop an appropriate benchmarking methodology in line with the European Benchmarking Co-operation. It will focus on establishing a reporting discipline taking into account quality of data, and will provide support to improve institutional capacity to monitor water sector performance and to use benchmarking as a management tool.
WATER SECTOR SUSTAINABILITY AND MAIN CHALLENGES
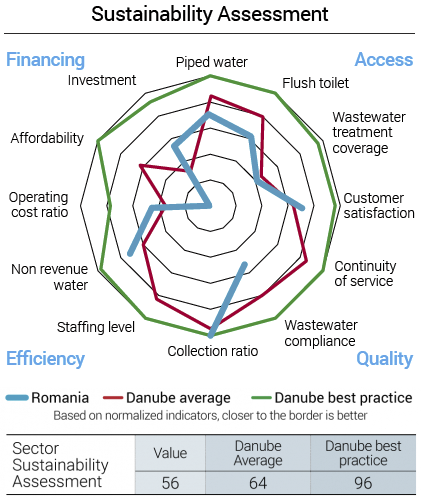
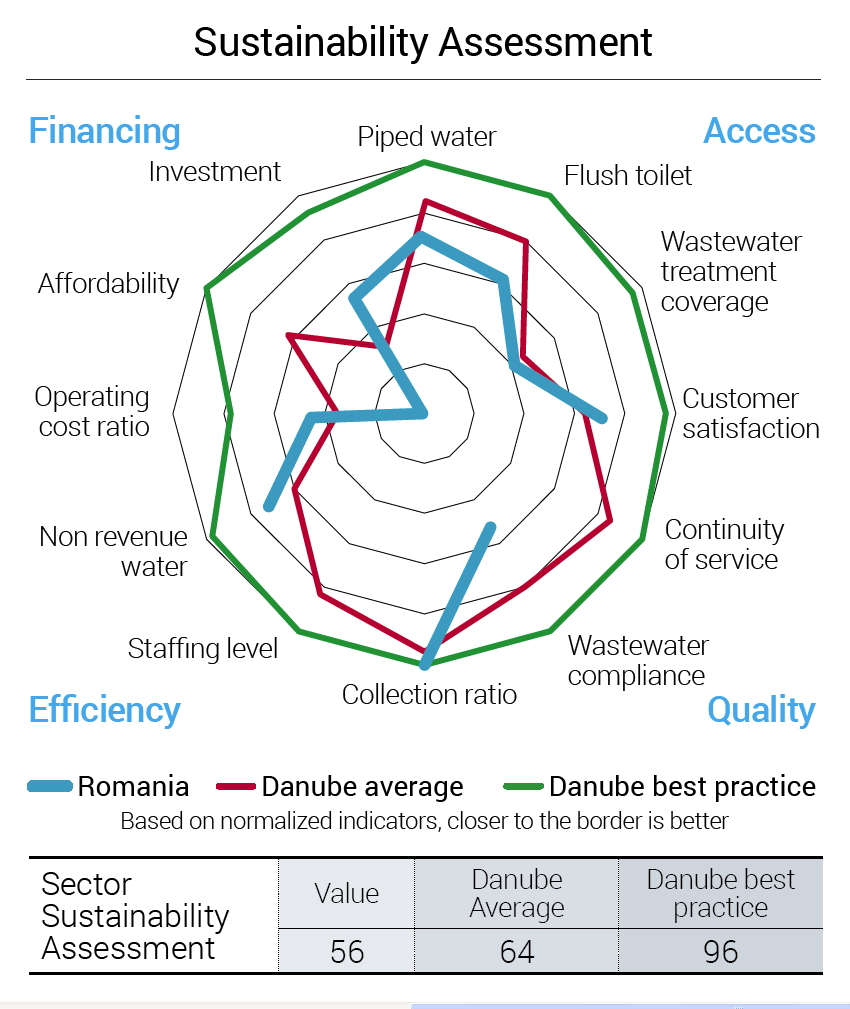
To evaluate and reflect the sustainability of services in the region, an overall sector sustainability assessment was done taking into account four main dimensions: access to services, quality of services, efficiency of services, and financing of services. Each of these dimensions is measured through three simple and objective indicators. For each indicator, best practice values are established by looking at the best performers in the region. Countries closest to those best performers are deemed to have a more mature sector. A more complete description of the methodology to assess the sector sustainability is included in the Annex of the State of the Sector Regional Report from the Danube Water Program.
The outcomes of this assessment for Romania’s water sector are displayed in Figure 12, which also shows average and best practices in the Danube region. The Romanian sector sustainability score is 56, which is below the Danube average sustainability of 64, and which is among the lowest scores in the region. This is partly due to the fact that a large percentage of Romania’s population lives in rural areas, where only 29% are connected to piped water and 10% has access to flush toilets (UNECE/WHO 2010). Aside from that, the main deficiencies identified regarding the Romanian water sector through the sector sustainability assessment are affordability, wastewater compliance, and operating cost ratio. Romania is, however, performing well in terms of collection ratio and customer satisfaction (Figure 12).

The main sector challenges are:
- Improving access to water and sanitation services in rural areas. With a low rate of rural population having access to piped water (29%) and flush toilets (10%) (UNECE/WHO 2010), improving access to water and sanitation in rural areas is a key challenge for Romania. Completion of the regionalization of water services, stated in the Sector Operational Programme, which was planned to overcome excessive sector fragmentation and to achieve economies of scale, has yet to be achieved. This process has led to the creation of 42 Regional Operating Companies (ROCS) operating water utilities on behalf of Inter-communal Development Associations (IDAs), composed of local authorities. Completion of this regionalization process could help improve the quality of and access to water and wastewater infrastructure for the unserved population, especially in rural areas.
- Strengthening the capacity of operators to ensure implementation of investment projects. The capacity-strengthening scheme included in the Sector Operational Programme is designed to provide support to local authorities to implement an integrated multiyear capital investment program in order to improve the standards of municipal water and wastewater services by creating efficient, financially viable, and autonomous integrated regional service providers able to plan and implement investments in line with EU policies and practices. To this end, investments are identified and prioritized to include components that reduce costs, and to improve efficiency and basic services. New meter installation programs, pressure and flow monitoring, reduction of unaccounted-for waters, reduction of infiltrations in the sewerage systems, etc., represent components of every investment project as part of demand management programs. Such capacity-strengthening schemes are a key element to ensure that investments required to comply with all EU acquis requirements, which amount to €15 billion, are effectively implemented by 2027.
- Addressing affordability issues regarding water and sanitation prices. Affordability of water is potentially an issue for a majority of the Romanian population, with the average share of potential water and sanitation expenditures at more than 5%. The upcoming investment efforts, which will be partly financed by EU funds and partly by tariff increases, could exacerbate the affordability issue in the future.
- Improving efficiency of water utilities. The regionalization of water services was designed and planned to overcome excessive sector fragmentation and to achieve economies of scale. Now that the process is complete, water providers can focus on improving the efficiency of their utilities by reducing nonrevenue water and staffing level which are considered high in comparison with other countries in the region, by increasing metering level. There is also a need to introduce financial and operational discipline in utilities management methods to enhance services efficiency.
SOURCES
- ANAR. 2012. Romanian Waters: National Administration. Accessed 2015. http://www.rowater.ro/sites/en/Site%20Content/Home/About%20us.aspx.
- ANR. 2015. National Agency for the Roma. Accessed 2015. http://www.anr.gov.ro/.
- ANRSC. 2012. Annual Report of the National Regulation Agency for Public Services for Water. Bucharest: National Regulation Agency for Public Services of Romania.
- —. 2015. National Regulation Agency for Public Services of Romania. Accessed 2015. http://www.anrsc.ro.
- ARA. 2015. Romanian Water Association. Accessed 2015. http://www.ara.ro.
- Eurostat. 2014. European Commission Directorate-General Eurostat: Statistics Explained - Water Statistics. Accessed 2015. http://ec.europa.eu/eurostat/statistics-explained/index.php/Water_statistics.
- FAO Aquastat. 2015. Food and Agriculture Organization of the United Nations - AQUASTAT Database. Accessed 2015. http://www.fao.org/nr/water/aquastat/data/query/index.html?lang=en.
- Gallup. 2013. World Poll. Accessed 2015. http://www.gallup.com/services/170945/world-poll.aspx.
- GHK. 2006. Strategic Evaluation on Environment and Risk Prevention under Structural and Cohesion Funds for the Period 2007-2013 - National Evaluation Report for Romania. Brussels: GHK Consulting Ltd.
- IBNet. 2015. The International Benchmarking Network for Water and Sanitation Utilities. Accessed 2015. http://www.ib-net.org.
- ICPDR. 2006. Danube facts and figures: Romania. Vienna: International Commission for the Protection of the Danube River.
- —. 2015. International Commission for the Protection of the Danube River. Accessed 2015. http://www.icpdr.org.
- INS. 2013. Statistical Yearbook 2013. Bucharest: National Institute of Statistics of Romania.
- —. 2014a. Press Release No. 176 of July 18, 2014: Public utilties of local interest in 2013. Bucharest: National Institute of Statistics of Romania.
- —. 2014b. Press Release No. 232 of September 26, 2014: Water distribution in 2013. Bucharest: National Institute of Statistitcs of Romania.
- —. 2015a. National Institute of Statistics of Romania. Accessed 2015. http://www.insse.ro/cms/en.
- —. 2015b. National Institute of Statistics of Romania: Environmental Indicators. Accessed 2015. http://www.insse.ro/cms/files/IDDT%202012/tema2_en.htm.
- MMediu. 2012. Sectoral Operational Programme Environment 2007 - 2013. Bucharest: Ministry of Environment and Forests of Romania.
- MS. 2010. Drinking Water Quality - Synthetic Report. Bucharest: Ministry of Health of Romania.
- UNDP/World Bank/EC. 2011. Regional Roma Survey. New York: United Nations Development Programme, World Bank and European Commission.
- UNECE/WHO. 2010. Summary Report under the Protocol on Water and Health: Progress of Implementation in Romania. Geneva: United Nations Economic Commission for Europe and World Health Organization.
- World Bank. 2014. Diagnostics and policy advice for supporting Roma inclusion in Romania. Washington, DC: World Bank.
- —. 2015. World Development Indicators. Accessed 2015. http://databank.worldbank.org/data/views/reports/tableview.aspx.