 Bulgaria
- Water Snapshot
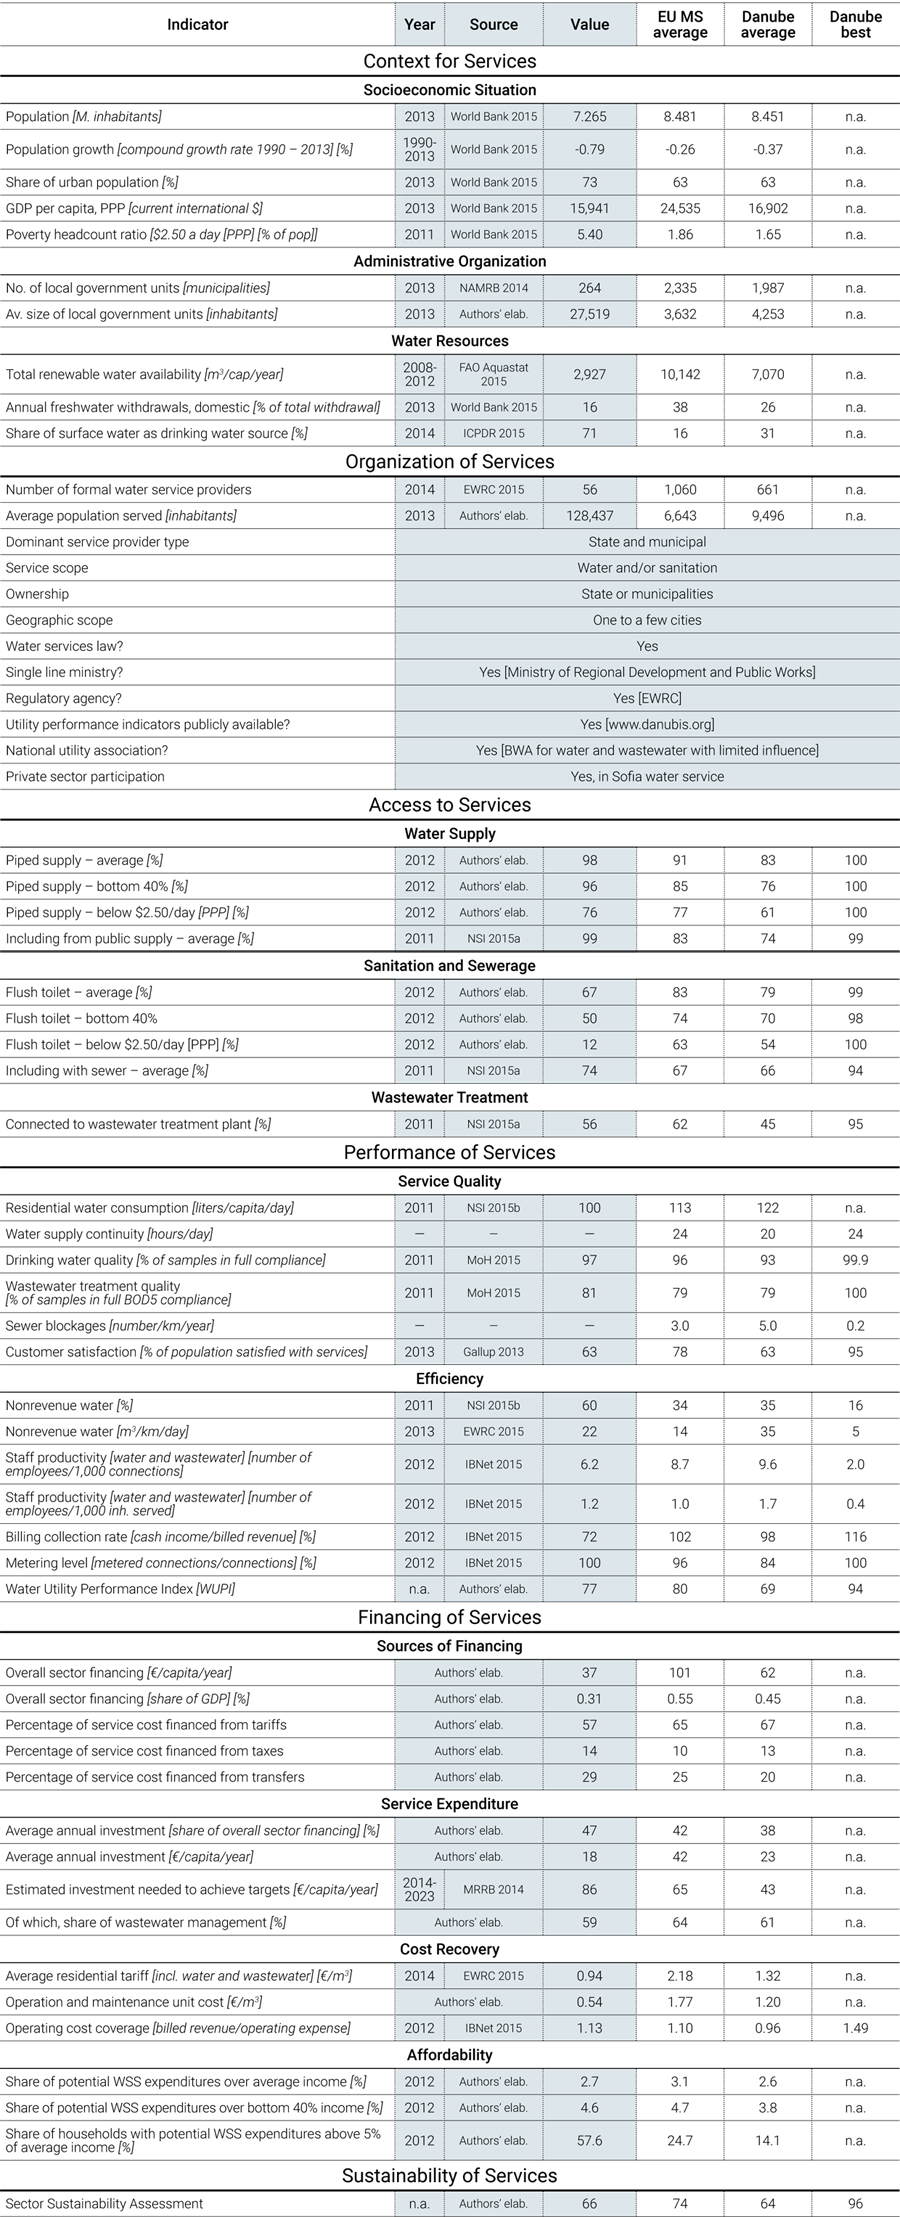
- Context for Services
- Organization for Services
- Access to Services
- Performance of Services
- Financing of Services
- Water Sector Sustainability and Main Challenges
- Sources
WATER SNAPSHOT
Sources for all numbers in the snapshot are provided in full in the body of this country page; a complete description of the methodology is provided in the State of the Sector Regional Report available under SoS.danubis.org/Report.
 |
 |
Key Water and Sanitation Sector Challenges
-
Financing the renewal and upgrading of water and sanitation infrastructure. Bulgaria continues to face major challenges meeting the national and European water and sanitation services requirements, since approximately €5.9 billion will be needed from 2014 to 2020.
-
Ensuring the financing and affordability of water tariffs in the future. Due to investment forecasts, some issues regarding capital and operating costs recovery will arise in the near future. EU funds will be able to finance only around 30% of total needed capital investments. Hence, the actual water price will most likely increase, potentially pushing prices beyond the affordability threshold of lower-income households. The water supply and sanitation strategy 2014-2023 underscores the necessity to address the water sector inefficiencies (high nonrevenue water, low collection ratio) in order to ensure public acceptance of tariffs.
-
Improving water utility staff capacity and training. In addition to financing challenges, education and training of staff at all levels of water utilities will be necessary to ensure the sustainable development of the water sector.
Further resources
On water services in the Danube Region
- A regional report analyzing the State of Sector in the region, as well as detailed country notes for15 additional countries, are available under SoS.danubis.org
- Detailed utility performance data is accessible, if available, under www.danubis.org/database
On water services in Bulgaria
The following documents are recommended for further reading; the documents, and more, are available at www.danubis.org/eng/country-resources/bulgaria
- MRRB. 2013. Advisory Program for the Development and Implementation of a Water Supply and Sanitation Strategy in Bulgaria, Public Expenditure Review. Sofia: Ministry of Regional Development and Public Works of the Republic of Bulgaria.
- —. 2014. Strategy for Development and Management of the Water Supply and Sanitation Sector in the Republic of Bulgaria 2014 - 2023. Sofia: Ministry of Regional Development and Public Works of the Republic of Bulgaria.
Context for Services
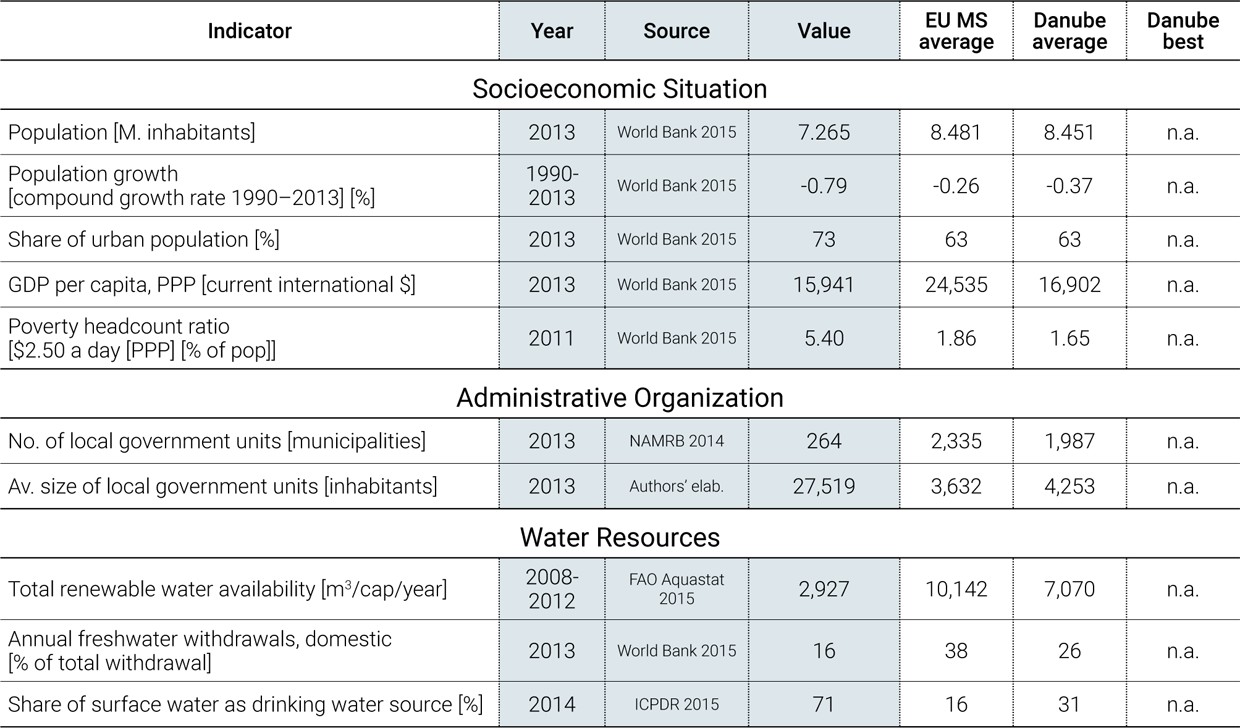
Economy. Bulgaria, which has been an EU Member State since 2007, is an emerging market economy that has had negative population growth since the early 1990s. Since 2001, GDP grew at an average 6% per year, driven by considerable foreign direct investment. As a result of the 2007-2008 financial crisis, Bulgaria’s economy declined in 2009 by 5.5%, but quickly returned to a positive growth rate in 2010, in contrast to other Balkan countries (World Bank 2015). At the same time, there remain significant socioeconomic differences among Bulgarian regions. For example, the Southwest territorial unit leads the country in key economic development indicators, but the Northwest and North-central units are in the two last places in the entire EU. The negative growth in population in Bulgaria can be attributed to a fertility rate among the lowest in the world and a death rate among the highest. According to the 2011 census, in the last 10 years, the rural population decreased by 11%, and the urban population increased by 5%. Approximately one-sixth of the total population is concentrated in Sofia. Bulgarians, the main ethnic group, comprise 84.8% of population. Turkish and Roma minorities comprise 8.8% and 4.9%, respectively.
Governance. Bulgaria is a unitary state with strong administrative regions. The country is divided into 28 regions (oblasti, singular oblast), including the metropolitan capital Sofia-Grad. Each oblast takes the name of its biggest city. The regions are further subdivided into 264 municipalities. While municipalities are run by locally elected mayors and municipal councils, regions are administered by governors directly appointed by the Council of Ministers. Bulgaria is highly centralized, and the regions and municipalities are heavily dependent on the central government for funding (NAMRB 2014).
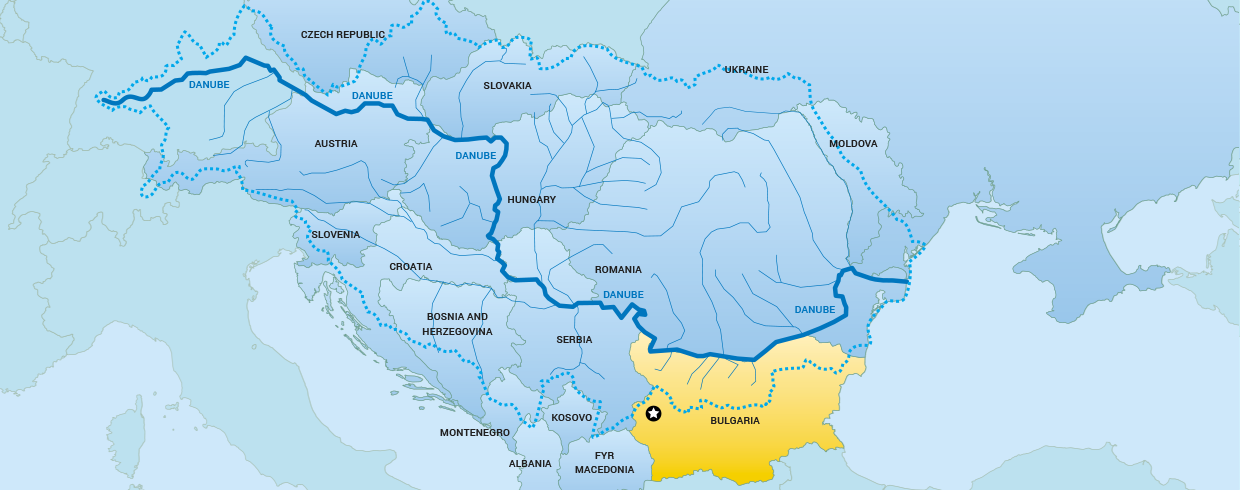
Water resources. According to an analysis of projected water demand, Bulgaria is not a water-stressed country. Over 60 rivers flow through Bulgaria, and the Danube, at 470 km, is the longest in the country. There are also 6 lakes and 23 dams. The country is divided into 4 catchments regions: the Danube, Black Sea, Eastern Aegean, and Western Aegean. Annual river runoff is expected to decrease up to 14% in the next 50 years and to be 20% less at the end of the century due to current climate trends. An analysis of the projected domestic water consumption and internal water resource base suggests that Bulgaria is not a water-stressed country. Since 1990, abstractions for both agricultural and industrial purposes have fallen drastically, contributing to its overall low water stress. Yet, there are areas of Bulgaria that experience water scarcity and, in particular, seasonal water scarcity in dry summers. The most vulnerable areas with rainfall below 300 mm are Pavlikeni, Sofia, and Vidin to Lom Montana in the Danube region; Shabla-Varna in the Black Sea region; Panagyurishte, Pazardzhik, Plovdiv, Sadovo, and Sliven and in the East Aegean Sea region; and Blagoevgrad, Kyustendil, and Sandanski in the West Aegean Sea region. The Bulgarian government has adopted the Third Action plan on climate change, which aims to mitigate the impact of climate change. The action plan covers a wide range of sectors, but water is excluded from the analysis, the scenarios, and the mitigation measures identified in the plan (MoEW 2014).
Water supply sources. Surface water is the main source for drinking water supply (71%). Surface water provides 52% of the total raw water abstracted, and groundwater provides the other 48%. Groundwater is of good quality in all river basins despite nitrate pollution. Seventy-nine percent of groundwater abstracted is used for public water supply; 17% for industry; 2% for agriculture, forestry, and fisheries; 2% for services. The rest is used for irrigation. Surface water is polluted by domestic water from urban sewerage systems and by untreated industrial wastewater discharged into rivers (MoEW 2014).
Organization for Services
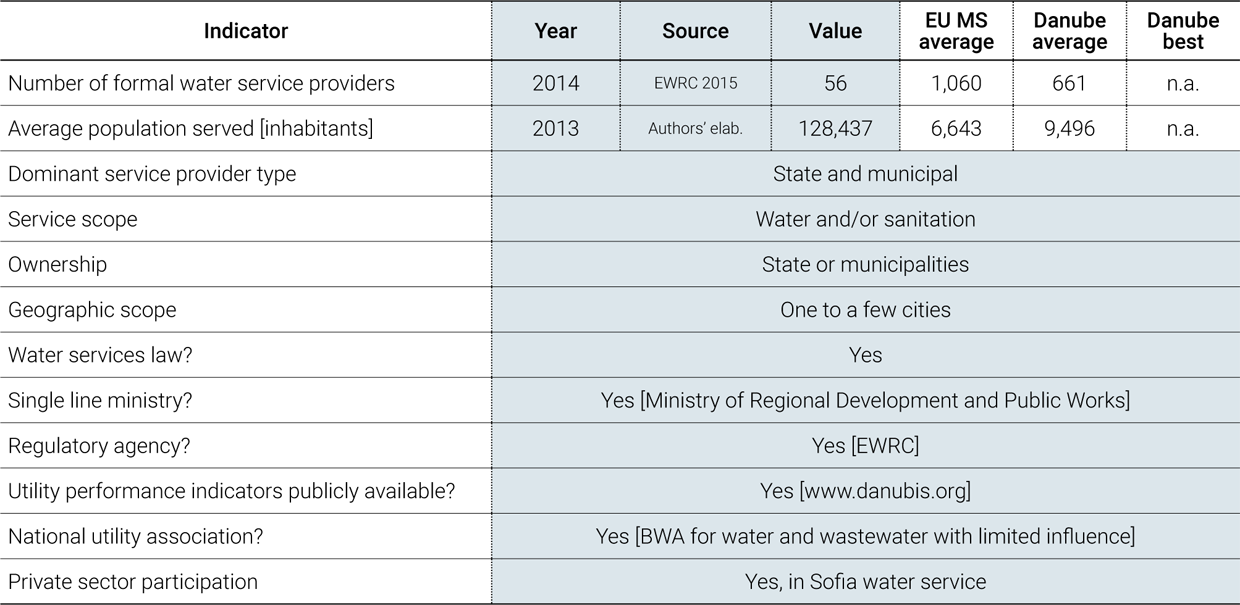
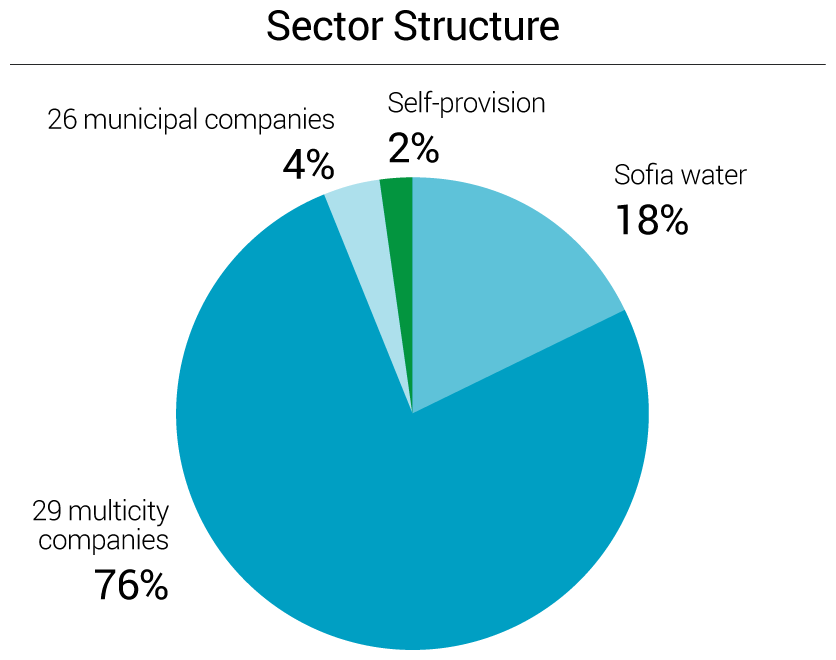
 Service provision. Water services are owned either by the state or by municipalities. Bulgaria has 64 water and sanitation service providers, of which 56 are state owned. The 29 regional water companies provide services to 76% of the population, with the rest of service providers serving single municipalities (Figure 1). Fourteen multicity utilities are state-owned water companies. They cover the largest area of the country, and they are managed by the Ministry of Regional Development. The other utilities are owned by municipalities. The Sofia water service is the only water concession awarded to a private company for 25 years (EWRC 2015).
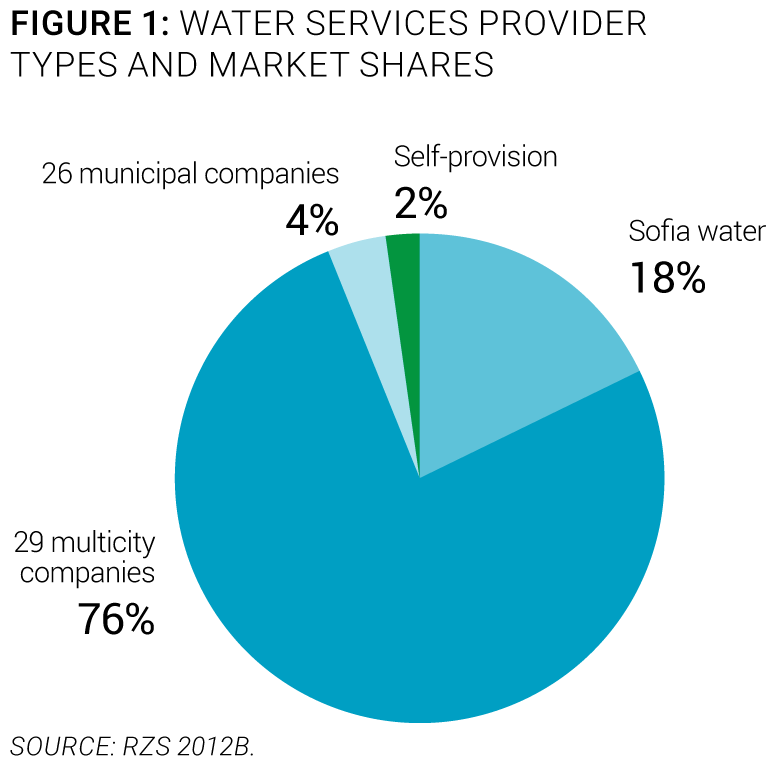
Policy-making and sector institutions. The sector is controlled by national institutions. The Water Act sets the legal framework and defines the responsibilities of the four institutions involved in the water sector (Figure 2), which are:
- The Ministry of Regional Development and Public Works, which is the sector line ministry responsible for coordinating management of the water and sanitation sector at the national level. It develops and implements the state water policy, acts in the capacity of a principal owner of the 14 regional companies owned by the state or for which the state provides capital, and maintains a unified information system and registry of water supply and sanitation (WSS) associations and operators (MRRB 2015).
- The Ministry of Environment and Waters, which is responsible for environmental protection and water resource management (MoEW 2015).
- The Ministry of Health, which is responsible for monitoring drinking water quality (MoH 2015).
- The Energy and Water Regulatory Commission (EWRC), which is an independent regulatory authority tasked with approving business plans and water and wastewater tariffs, monitoring performance indicators, and reviewing complaints filed by consumers. It is composed of 9 members with experience in water supply and sewerage who are appointed by the parliament for 5 years (EWRC 2015).
Capacity and training. Improving staff capacity is a challenge for most Bulgarian water utilities. In 2009, 18,000 people were employed in water collection, treatment, and supply (Eurostat 2015a). In state-owned companies, the average number of employees ranges from 300 to 950, whereas in municipal-owned companies it ranges from 30 to 90. The national water association comprises mainly state-owned water and sanitation utilities, but some municipal water utilities have recently joined. It provides neither training nor capacity-building programs, and as a result, building institutional capacity for water stakeholders is a challenge. However, the Sofia water utility regularly implements training programs for its staff (Sofiyska Voda 2014).
Economic regulation. A national agency is responsible for both economic regulation and regulation of the energy sector. The Regulation of Water and Sanitation Services Act established the Energy and Water Regulatory Commission (EWRC), an independent specialized state body consisting of 9 members, of which two must have a minimum number of years’ experience in the field of WSS. The responsibilities of the EWRC include (a) drafting statutory instruments for the water sector, (b) approving water services business plans, (c) approving prices of water supply and sewerage services in response to applications by utility companies, (d) overseeing the achievement of target values for service-level indicators by services, and (e) handling consumer complaints (EWRC 2015). The Regulation of Water and Sanitation Services Act also establishes the legal framework for ownership and management of waters as a national natural resource, and ownership of water development systems and facilities (Parliament BG 2011).
Ongoing or planned reforms. Water sector restructuring reforms increased the number of water utility companies. Until 1989, Bulgaria’s water and sanitation services needs were covered by 28 regional utility companies and 1 municipal company for Sofia. Their territorial scope coincided with the country’s subdivision into 28 administrative districts. All utility companies were 100% state owned, with the exception of the one in Sofia, which was owned by the municipality. With the general economic restructuring and decentralization of the 1990s, some of the water companies were split and reorganized into companies jointly owned by the state and municipalities, whereby the state transferred 49% of the capital to the municipalities served by the companies. This process led to a substantial increase in the number of water utility companies and to greater heterogeneity in asset ownership and utility ownership. Some companies remained 100% state owned, while others (usually the smaller ones, serving one municipality) were wholly transferred to the municipalities served. Resulting inconsistencies in the ownership of regional water storage and transmission infrastructure are yet to be resolved (MoEW 2011). Building upon these findings, the 2014-2023 Water supply and sanitation strategy provides for full transfer of asset ownership, enhanced autonomy of operators, and consolidation of the water sector (MRRB 2014).
Access to Services

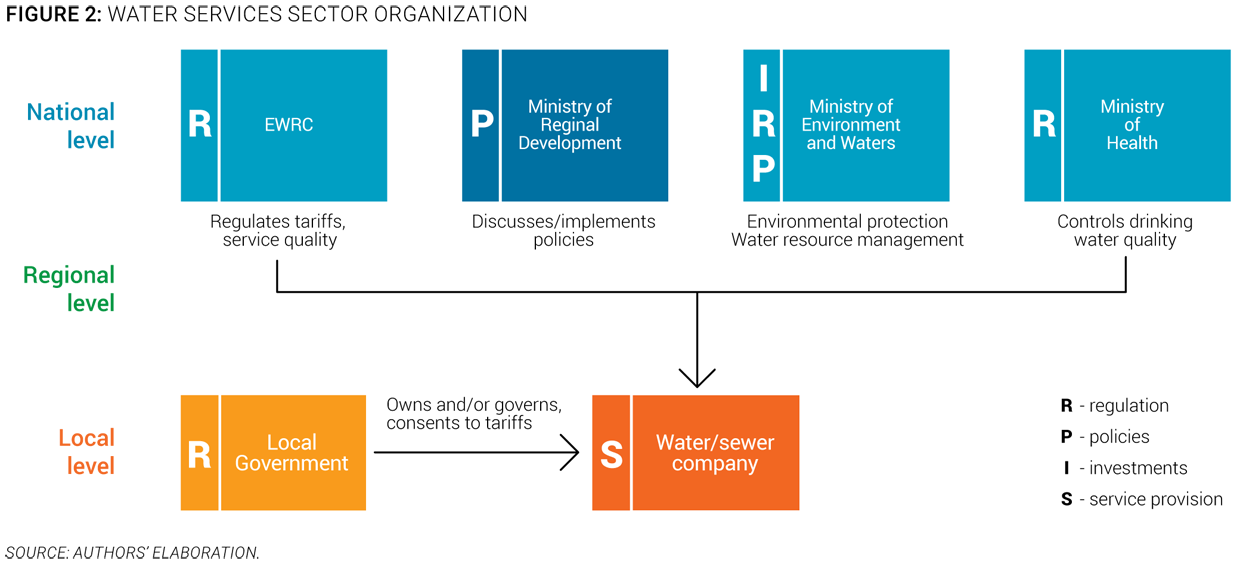
Service coverage. Almost all Bulgarians have access to water services, but access to sanitation services is lagging. Ninety-eight percent of the Bulgarian population has access to piped water supply (Figure 3), a rate that is high by regional and European standards. Wastewater collection coverage, however, remains low at 74%, and wastewater treatment coverage is even lower at 56% (NSI 2015a). Insufficient investment in wastewater infrastructure since Bulgaria joined the EU in 2007 has, in fact, caused it to miss an interim deadline under the EU Urban Wastewater Treatment Directive to ensure that wastewater collection and treatment facilities are available for agglomerations above 10,000 population equivalent (p.e.) by the end of 2010.
Equity of access to services. Access to sanitation services is a problem for vulnerable populations. The access rate to piped water for the bottom 40% of the population is high, at 96%, whereas it is low for flush toilets, at 50%. Only 76% of the poorest share of the population (those living on less than $2.50/day PPP) has access to piped water supply and only 12% to flush toilets (Authors’ elaboration). Only 5% of the Roma population does not have access to an improved water source, whereas 41% does not have access to improved sanitation (UNDP/World Bank/EC 2011).
Bulgaria Data Availability
The availability of data on the water sector is good, since the SEWRC gathers information on most performance indicators for water and sanitation services. However, some information on funding of services is missing.
Service infrastructure. The water and sanitation infrastructure requires renovation, renewal, and extension. The Bulgarian water and sanitation infrastructure was mainly built in the 1960s and 1970s (MRRB 2014). The networks are mainly made of steel and eternite (fiber cement). There is a high level of corrosion, which poses a risk to water quality. The infrastructure is quite old in general, and needs to be renovated. Over 20% of the infrastructure is amortized and needs reconstruction. A segment of the water equipment does not provide the necessary quantity of water to consumers and needs extension and renewal.

Performance of Services
Service Quality

Quality of service. In the last 10 years, there has been considerable improvement in the quality of drinking water (Figure 4). As a result, today the quality of Bulgaria’s drinking water is generally good, and it is supplied on a continuous basis. Still, microbiological noncompliance (such as presence of E. coli) exceeds 5% in 5 regions. Deviation from the norm is characteristic of small water supply systems that do not have treatment facilities and that thus release water to the population after simple chlorination. Water quality may also be compromised by insufficient monitoring performed by water supply and sanitation companies. As a temporary measure, the Ministry of Health may perform monitoring functions ( MoH 2015).

Customer satisfaction. The satisfaction of the population with the service provided in their city is very low at 63% (Gallup 2013). This number is among the lowest of the countries in the region.
Efficiency of Services

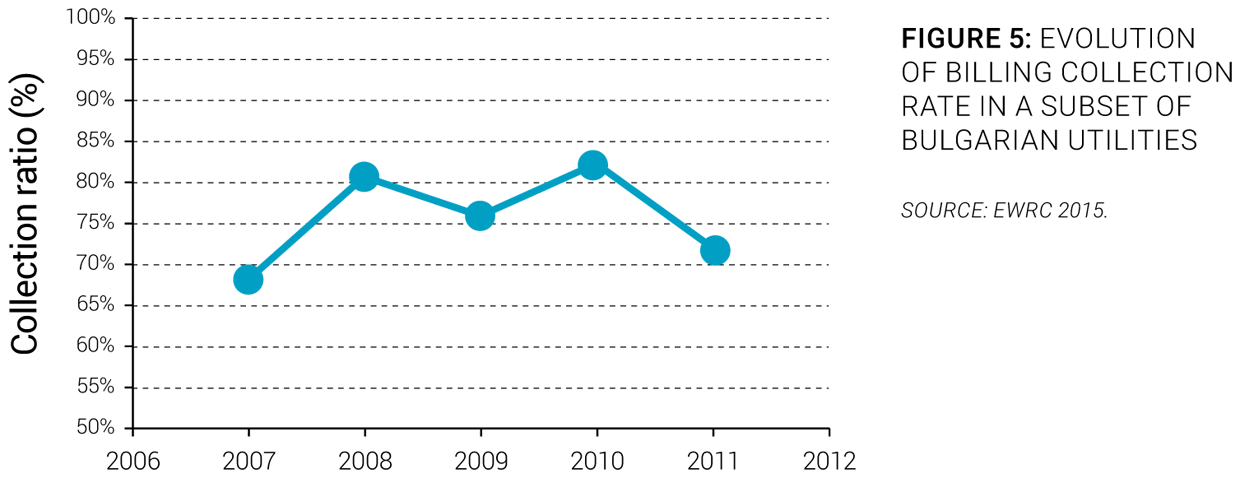
Overall efficiency. Important water losses and low staff productivity prevent Bulgarian water utilities from improving efficiency. Bulgaria has a higher level of nonrevenue water than most European countries. In 2011, it amounted to 60% of water produced and 564,375 m³ in absolute losses (NSI 2015b). By some accounts, water losses in urban areas reach 60 m³ per km per day (GWI 2005). The greater share of nonrevenue water can be attributed to physical losses, since 90% of the network was built before 1990 (MRRB 2014). Bulgarian water companies also tend to be overstaffed. In terms of staff per 1,000 connections, Bulgarian companies employ more staff than other EU countries (EWRC 2015). While this contrast can be moderated to some extent by the fact that Bulgarian water companies perform most activities in-house, with practically no outsourcing, their staff productivity is still much lower than the levels of well-operated utilities. The billing collection ratio amounted to 72 in 2012 (Figure 5).
Recent trends. Priority is given to water sector efficiency gains to improve sustainability. The government’s policy priorities were identified in the 2013 Water Strategy. According to the document, the strategic objectives of the sector are (a) environmental, technical, and financial sustainability of water services; (b) affordability of water services to consumers; (c) improved efficiency and service quality of Bulgarian water companies; and (d) compliance with all regulatory requirements by water stakeholders (MoEW 2014).
Financing of Services
Sector Financing
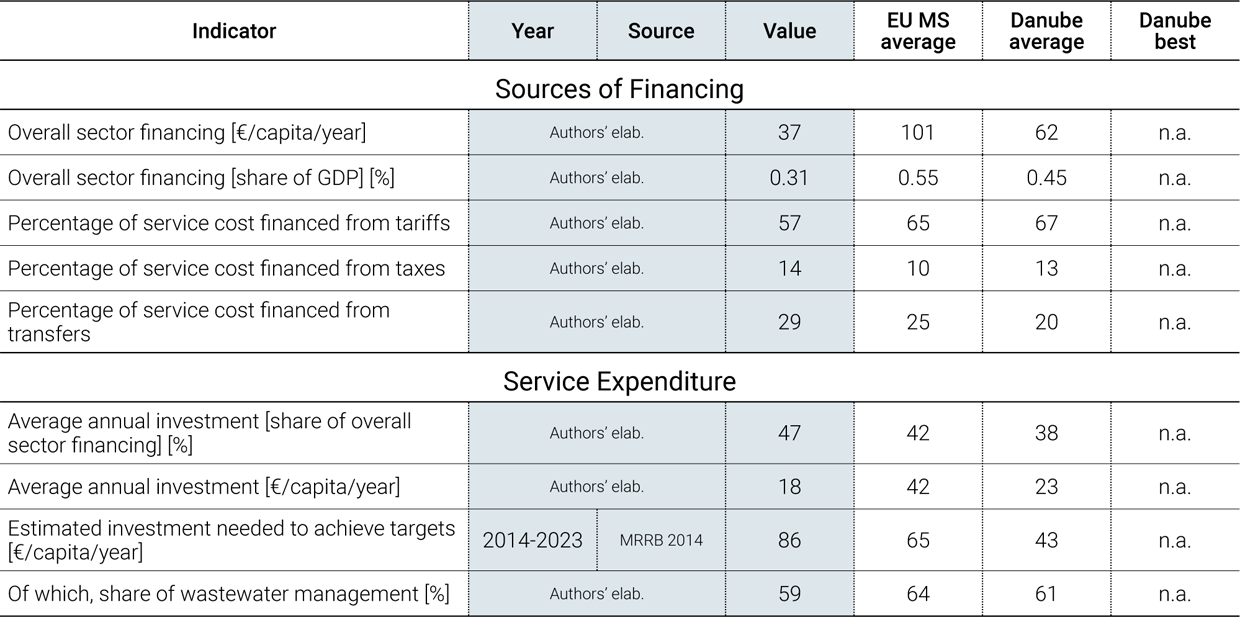
 Overall sector financing. Tariffs are the main source of funding of water utilities. Revenues collected from water tariffs represent 57% of the total financing of the sector (Figure 6). Those revenues cover operational costs, and investments are mostly funded by EU grants and are augmented by subsidies from local taxes through municipal budgets. Subsidies from the national budget are much less important.
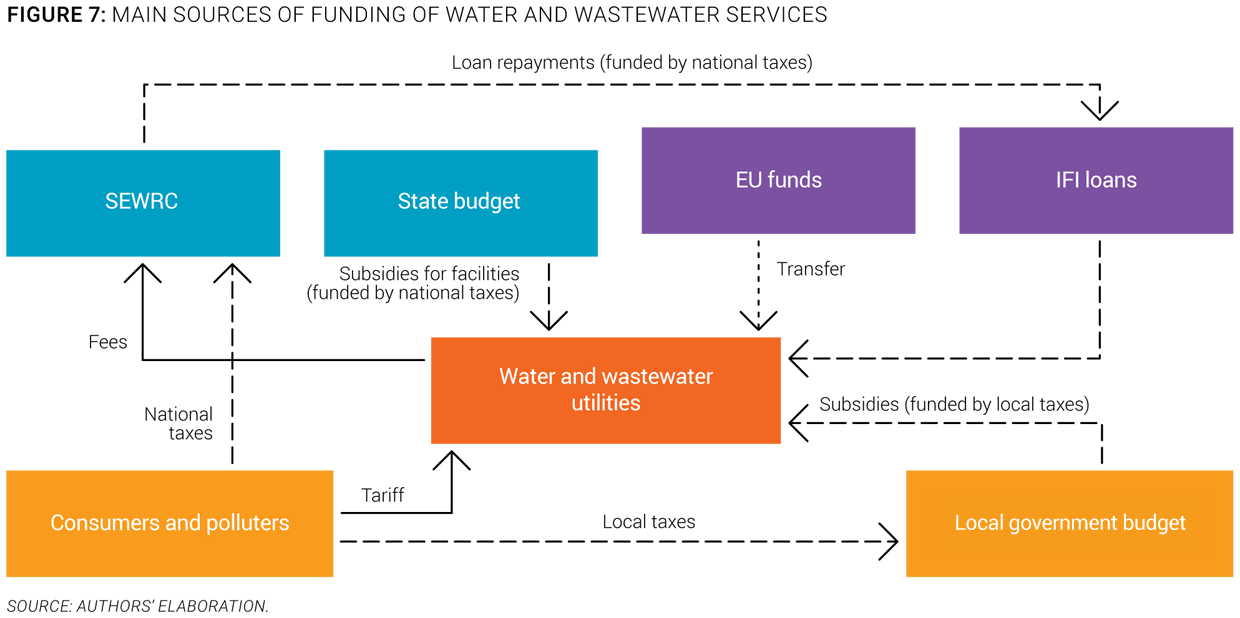
The main sources of funding of water and wastewater utilities are described in Figure 7, using the OECD three Ts methodology (tariffs, transfers, and taxes).
Investment needs. Four times the amount of current investments will be needed to improve the system. Approximately Lev 11.5 billion (€5.9 billion, or 5% of national GDP) will be needed over a 10-year period (2014-2023) for compliance investments and urgent rehabilitation and replacement projects. This will require four times the current capital expenditure. Since EU funds will cover only one-third of those needs, tariffs are expected to continue to rise in the future (MRRB 2014).
Investments. The current investment level in the sector corresponds to the average in the Danube region. An average of €18 is invested per inhabitant per year. Those investments are predominantly financed by local funds and are evenly shared between water and sanitation works (Figure 8).

Cost Recovery and Affordability
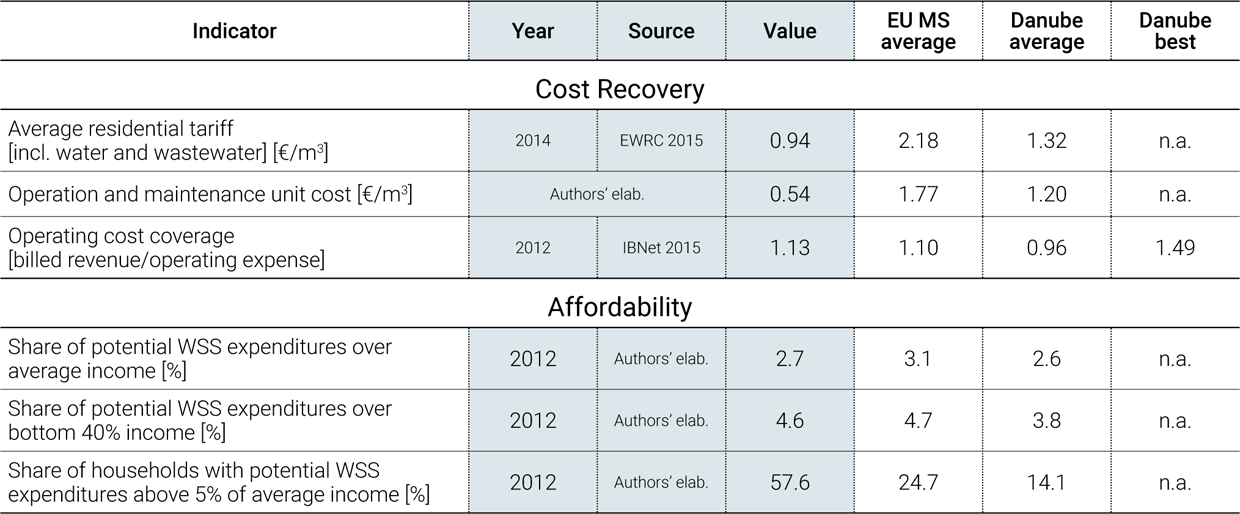
 Cost recovery. Water services revenues cover only operating costs. Tariffs represent the main sources of funding of sector operations and maintenance. Bulgarian water companies do not benefit from operational subsidies. While revenues from tariffs generally cover operating expenses, they are not sufficient to cover investment needs (Figure 9).
Tariffs. Water tariffs remain low despite a recent increase. At €0.94/m3, average water and wastewater tariffs in Bulgaria are lower than in most other Danube region countries. They have increased by more than 80% over a 5-year period from 2007 to 2014, while the average annual inflation rate was close to 8% (Figure 10). Tariffs are expected to continue rising due to further investment needs (EWRC 2015).
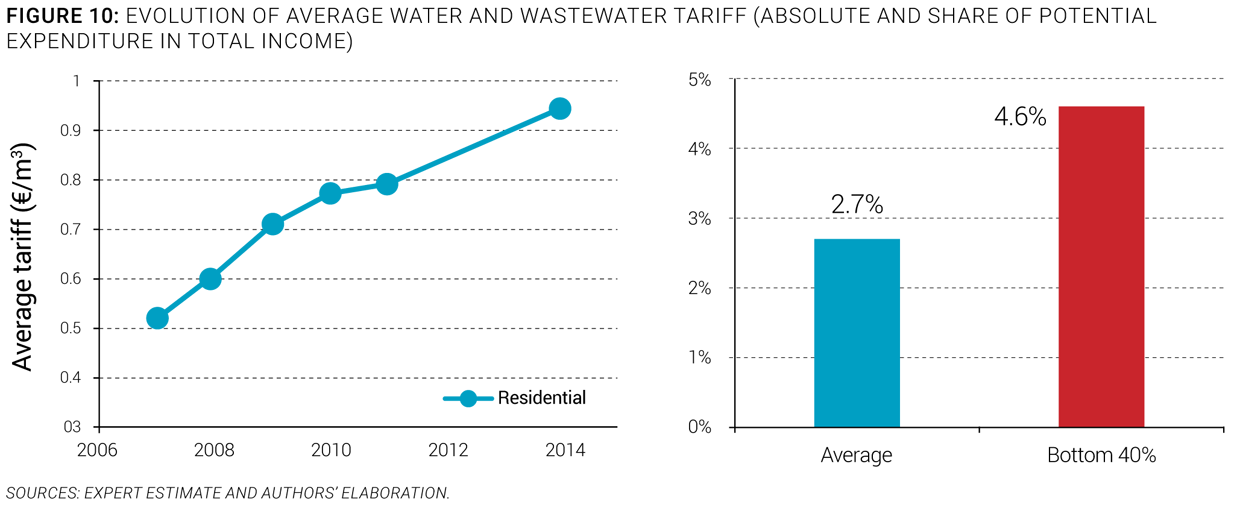
Affordability. Affordability is not currently an issue, but that may change due to significant compliance investments needs. Current monthly potential water and wastewater expenditure represents 2.7% of average monthly household income, but in order to finance operation and maintenance improvement costs, water tariffs will need to increase. The Regulation on Water and Sanitation Services Act states that the price of 2.8 m³ of water per person per month should not exceed 4% of the average monthly household income at the district level. However, the average water bill for a household in the bottom 40% of the population connected to public service would potentially represent 4.6% of income, and a household in the poorest decile connected to public service would potentially pay more than 15% (Authors’ elaboration). These values appear above the international threshold of 4 to 5%.
Water Sector Sustainability and Main Challenges
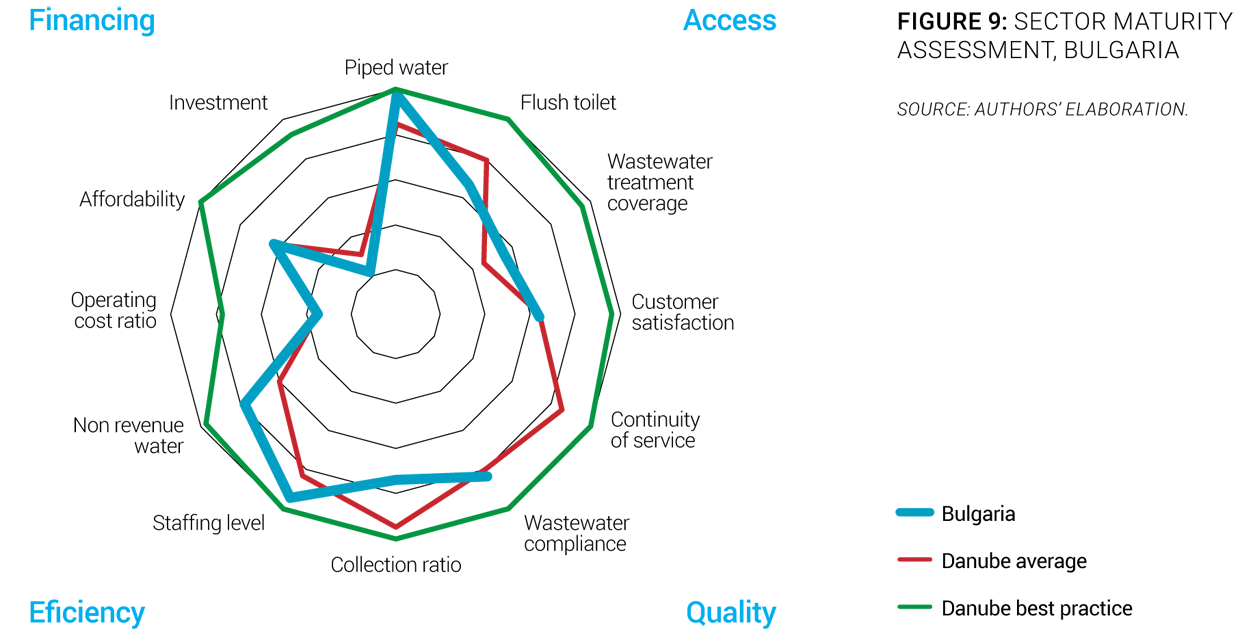
To evaluate and reflect the sustainability of services in the region, an overall sector sustainability assessment was done taking into account four main dimensions: access to services, quality of services, efficiency of services, and financing of services. Each of these dimensions is measured through three simple and objective indicators. For each indicator, best practice values are established by looking at the best performers in the region, and countries closest to those best performers are deemed to have a more mature sector. A more complete description of the methodology to assess the sector sustainability is included in the Annex of the State of the Sector Regional Report from the Danube Water Program. The outcomes of this assessment for Bulgaria’s water sector are presented in Figure 11, which also shows average and best practices in the Danube region. The Bulgarian sector sustainability score is 66, which is just above Danube average sustainability of 64. The assessment shows that, on average, the country performs well in terms of access to piped water, staffing level, and nonrevenue water. The main deficiencies of Bulgaria’s water sector identified through the sector sustainability assessment are operating cost coverage, investment level, and customer satisfaction level (Figure 11).
The main sector challenges are:
-
Financing the renewal and upgrading of water and sanitation infrastructure. Bulgaria continues to face major challenges meeting the national water and sanitation services requirements. Preliminary World Bank calculations based on the short-term investment programs of the Regional Master Plans indicated that approximately Lev 11.5 billion (€5.9 billion) will be needed over a 10-year period (2014-2023). Lev 7.5 billion of this amount is considered to be compliance costs, and Lev 4 billion is for urgent rehabilitation and replacement projects (MRRB 2014).
-
Ensuring the affordability of water tariffs in the future. Due to investment forecasts, some issues regarding capital and operating costs recovery will arise in the near future. EU funds will be able to finance only around 30% of the total needed capital investments. Hence, the actual water price will most likely increase, potentially pushing prices beyond the affordability threshold of lower-income households (MRRB 2014). The water supply and sanitation strategy 2014-2023 underscores the necessity of addressing the water sector inefficiencies (high nonrevenue water, low collection ratio) in order to ensure public acceptance of tariffs. Consolidation of the water sector is also provided for to achieve economies of scale and overcome governance issues (MRRB 2014).
-
Improving water utility staff capacity and training. In addition to financing challenges, education and training of staff at all levels of water utilities will be necessary to ensure the sustainable development of the water sector. Strengthening the institutional capacity of all water stakeholders is an important challenge to improve water sector efficiency and productivity (MRRB 2014).
Sources
- Eurostat. 2015a. European Commission Directorate-General Eurostat. Accessed 2015. http://ec.europa.eu/eurostat.
- —. 2015b. European Commission Directorate-General Eurostat: Database - Wastewater Treatment Plants by Treatment Level. Accessed 2015. http://ec.europa.eu/eurostat/data/database.
- EWRC. 2015. Energy and Water Regulatory Commission of the Republic of Bulgaria. Accessed 2015. http://dker.bg/indexen.php.
- FAO Aquastat. 2015. Food and Agriculture Organization of the United Nations - AQUASTAT Database. Accessed 2015. http://www.fao.org/nr/water/aquastat/data/query/index.html?lang=en.
- Gallup. 2013. World Poll. Accessed 2015. http://www.gallup.com/services/170945/world-poll.aspx.
- GWI. 2005. Water Market Europe: Opportunities in EU Accession, the Framework Directive & the CIS. Oxford: Global Water Intelligence.
- IBNet. 2015. The International Benchmarking Network for Water and Sanitation Utilities. Accessed 2015. http://www.ib-net.org.
- ICPDR. 2015. International Commission for the Protection of the Danube River. Accessed 2015. http://www.icpdr.org.
- MoEW. 2011. National Water Sector Management and Development Strategy. Sofia: Ministry of Environment and Water of the Republic of Bulgaria.
- —. 2014. Ministry of Environment and Water of the Republic of Bulgaria: Water - Strategic Documents. Accessed 2015. http://www.moew.government.bg/?show=top&cid=48.
- —. 2015. Ministry of Environment and Water of the Republic of Bulgaria. Accessed 2015. http://www.moew.government.bg.
- MoH. 2015. Ministry of Health of the Republic of Bulgaria. Accessed 2015. http://www.mh.government.bg.
- MRRB. 2013. Advisory Program for the Development and Implementation of a Water Supply and Sanitation Strategy in Bulgaria, Public Expenditure Review. Sofia: Ministry of Regional Development and Public Works of the Republic of Bulgaria.
- —. 2014. Strategy for Development and Management of the Water Supply and Sanitation Sector in the Republic of Bulgaria 2014 - 2023. Sofia: Ministry of Regional Development and Public Works of the Republic of Bulgaria.
- —. 2015. Ministry of Regional Development and Public Works of the Republic of Bulgaria. Accessed 2015. http://www.mrrb.government.bg.
- NAMRB. 2014. National Association of Municipalities in the Republic of Bulgaria. Accessed 2015. http://projects-namrb.org/index.php/en/local-government/general.
- NSI. 2015a. National Statistical Institute of the Republic of Bulgaria. Accessed 2015. http://www.nsi.bg/en.
- —. 2015b. National Statistical Institute of the Republic of Bulgaria: Water Statistics. Accessed 2015. http://www.nsi.bg/en/content/5132/water-statistics.
- Parliament BG. 2011. Water Act - SG No. 80/14.10.2011. Sofia: National Assembly of the Republic of Bulgaria.
- Povvik. 2014. Povvik - Consultants and Engineers on Environment and Sustainable Development. Accessed 2015. http://www.povvik.com.
- Sofiyska Voda. 2014. Sofiyska Voda: News Archive. Accessed 2015. http://www.sofiyskavoda.bg/en/NewsArticle.aspx?id=167.
- UNDP/World Bank/EC. 2011. Regional Roma Survey. New York: United Nations Development Programme, World Bank and European Commission.
- WaterWorld. 2015. Bulgaria’s Wastewater Mission. Accessed 2015. http://www.waterworld.com/articles/wwi/print/volume-25/issue-4/regional-spotlight/easter-europe/bulgaria-s-wastewater-mission.html.
- World Bank. 2015. World Development Indicators. Accessed 2015. http://databank.worldbank.org/data/views/reports/tableview.aspx.