 FYR Macedonia
- Water Snapshot
- Context for Services
- Organization for Services
- Access to Services
- Performance of Services
- Financing of Services
- Water Sector Sustainability and Main Challenges
- Sources
WATER SNAPSHOT
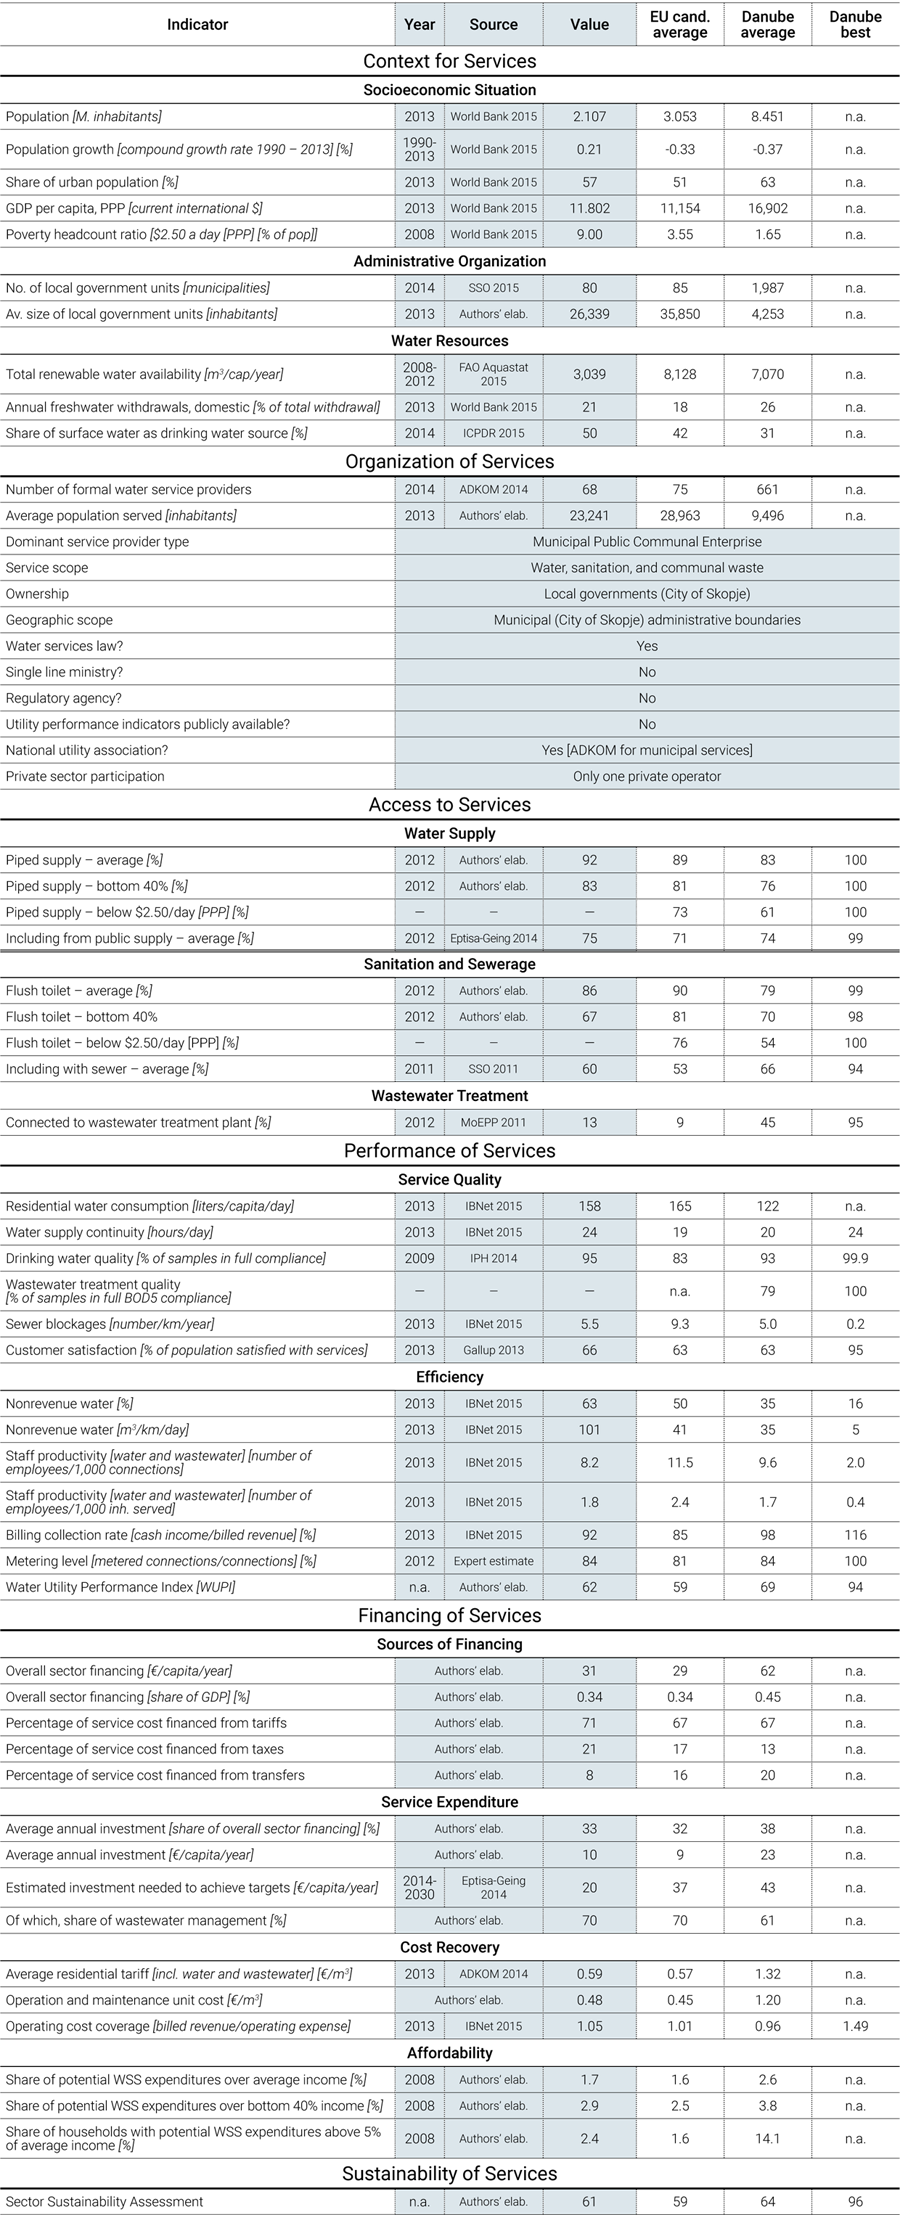
Sources for all numbers in the snapshot are provided in full in the body of this country page; a complete description of the methodology is provided in the State of the Sector Regional Report available under SoS.danubis.org/Report.
 |
 |
KEY WATER AND SANITATION SECTOR CHALLENGES
- Securing a multiyear investment budget. Current tariffs barely provide operating cost recovery, and the capacity of utilities to carry out investments is under serious threat, even while investments required to meet the EU acquis requirements represent €20/capita/year.
- Improving the efficiency of service providers. Reducing nonrevenue water, implementing structural changes, introducing the use of contemporary information and communications technology, and establishing an effective tariff system are strongly needed to improve the efficiency of the sector and achieve good practice levels.
- Implementing fully existing water legislation. Although the Law on Waters incorporates most EU water regulations and is well aligned with EU Directives, in practice the water legislation is not fully applied and its implementation remains modest.
FURTHER RESOURCES
On water services in the Danube Region
- A regional report analyzing the State of Sector in the region, as well as detailed country notes for15 additional countries, are available under SoS.danubis.org
- Detailed utility performance data is accessible, if available, under www.danubis.org/database
On water services in Hungary
The following documents are recommended for further reading; the documents, and more, are available at http://www.danubis.org/eng/country-resources/fyr-macedonia/
- ADKOM. 2014. Utilities Sector Analysis in the Republic of Macedonia. Skopje: Association of Public Utility Service Providers of the Republic of Macedonia.
- Bakllamaja, A., and G. Hristov. 2012. Assessment of Investment Needs and Institutional Policy Measures Water and Waste Water Sector: Republic of Macedonia. Skopje: European Investment Bank.
- Eptisa-Geing. 2014. Development of National Water Tariff Study - Identification and Selection of Alternative Concepts for Economic Instrument. Skopje: EPTISA-Geing Consortium.
- MoEPP. 2011. Water Strategy for the Republic of Macedonia. Skopje: Ministry of Environment and Physical Planning of the Republic of Macedonia.
- Ristovski, B. 2014. Report on Completed Benchmarking Project in 28 Utilities in the Republic of Macedonia - Municipal Services Investment Project (MSIP). Skopje: Government of the Republic of Macedonia and World Bank.
- World Bank. 2008. Republic of Macedonia: Strategy and Action Plan for Reform of Communal Services Enterprises with Focus on Water, Sewerage and Solid Waste Management - Municipal Services Investment Project (MSIP). Washington, DC: World Bank.
CONTEXT FOR SERVICES

Economy. FYR Macedonia has been an EU candidate country since 2005, but negotiations have not been opened yet. FYR Macedonia has a population of 2,107,158, 57% of which lives in urban areas (World Bank 2015). Average population density is 81.9 inhabitants per km2. At a per capita GDP of $11,802 (World Bank 2015), FYR Macedonia is considered an upper-middle-income economy. However, the overall economic situation is challenging, with a 28% unemployment rate and 26.2% of the population living below the poverty threshold in 2012. There are significant rural-urban differences in terms of demographic, economic, social, environmental, and health characteristics of the population (SSO 2015). Emigration has been high during the last 10 years, during which more than 230,000 people left the country. There are an estimated 135,490 Roma (6.8% of the population), although official data indicate much lower numbers (ERRC 2013).
Governance. The country is governed by a unitary system and 80 local governments including the City of Skopje, 33 urban and 37 rural municipalities, and 10 municipalities within the City of Skopje. Except for Skopje, no other administrative division (regions/counties) exists in between. For planning purposes, the country is divided into 8 regions. Municipalities in FYR Macedonia represent the lowest level of self-government and perform activities of local significance, including the provision of public services such as water and sanitation (SSO 2015).
Water resources. FYR Macedonia has sufficient water resources; however, they are unevenly distributed across the territory. FYR Macedonia is a landlocked country that is geographically defined by a central valley formed by the Vardar River. Surface waters cover 477 km2, or 1.88% of the territory. There are about 35 rivers, 53 natural and artificial lakes, and around 1,100 larger sources of water. The rivers flow into three river basin districts—the Aegean (the largest, covering 87% of the country territory), the Adriatic, and the Black Sea basin districts. Renewable water availability is estimated at 3,039 m3 per capita per year (FAO Aquastat 2015), and about one-third of the water resources are used.
FYR Macedonia is expected to face a 10% decrease in precipitation by midcentury, and 14% by the end of the century. With the projected decline in population, there is no need for FYR Macedonia to anticipate any significant change in per capita water resources. Sensitive areas in respect to wastewater, as well as the areas vulnerable to nitrate pollution and protected zones as defined in the Water Framework Directive, have not been identified. Due to climate change, it is expected that dry spells and flash floods will occur more often and with increased intensity in the eastern part of the country, and with less intensity in the western part. However, no specific climate mitigation strategies have been implemented, although several “high-priority adaption measures” have been proposed (such as reduction of water losses by reconstruction of the water delivery network of both irrigation and water supply systems, implementation of water efficiency schemes, water pricing, credit facilities, and insurance) (MoEPP 2011).
Water supply sources. Drinking water supply comes about equally from springs, groundwater, and surface water. In many urban municipalities combined sources are used, while rural water supply systems are mainly supplied from springs and groundwater. Lately, however, surface water has often been used, as well. The yearly average water availability from surface resources for a medium-dry year is 4.5 billion m3. Most of these resources are found in Vardar River basin (72%) and, to a lesser extent, in the Crn Drim River basin (26%) and the Strumica River basin (2%). The volume linked to springs is from 0.4 to 0.6 billion m3. The yearly volume of groundwater is about 0.3 to 0.5 billion m3, an estimate that is considered to be low. All water use per year is estimated from 1.5 to 1.7 billion m3, 84% of which is from surface water and 16% from groundwater and natural springs. About one-third of the water resources are used, which is indicative of a country with rather scarce water resources. Total abstractions for public water supply from fresh surface and groundwater sources (cubic meters per inhabitant) vary from 102 m3/capita (2002) to 133 m3/capita (2009). Water resources (ground- and surface waters) are relatively clean in their upper course, but rapidly worsen along their middle and lower courses due to untreated wastewater discharged mainly by human settlements, but also by industry and agriculture. Water bodies often do not comply with the quality objectives set for them, and groundwater protection in the country is behind that of developed countries, although according to monitoring results, groundwater quality is relatively high (MoEPP 2011).
ORGANIZATION FOR SERVICES
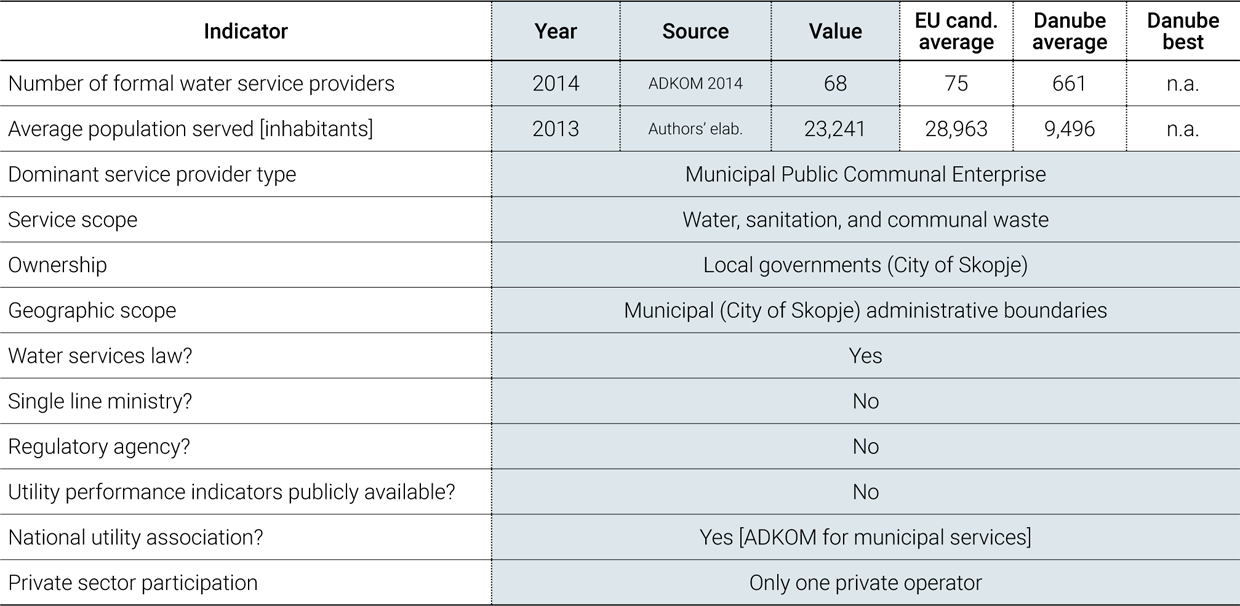
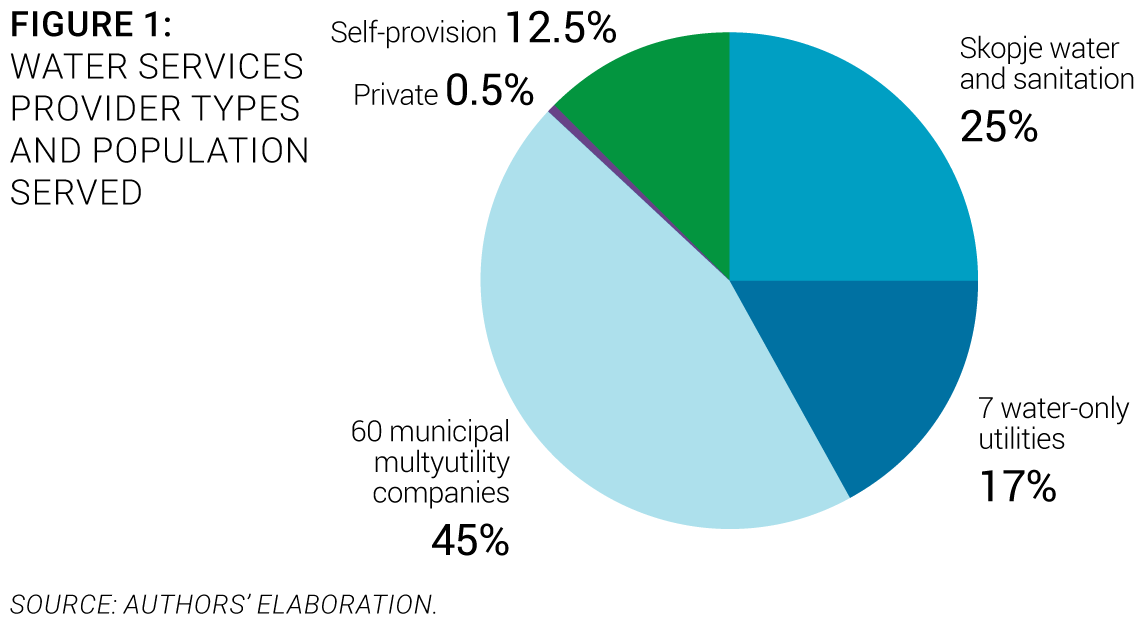
Service provision. Local governments are providing water and sanitation services through 68 public municipal utilities (ADKOM 2014). With an average population served of 23,241, the market is more atomized than the average in the region, and is dominated by the Skopje Water Company, which serves about 25% of the population. Seven water-only utility companies serve an additional 17% of the population, and 45% are served by 60 smaller municipal multi-utility companies. The rest of the population has access to self-provision (12.5%). There is only one private operator serving less than 10,000 inhabitants (Figure 1).
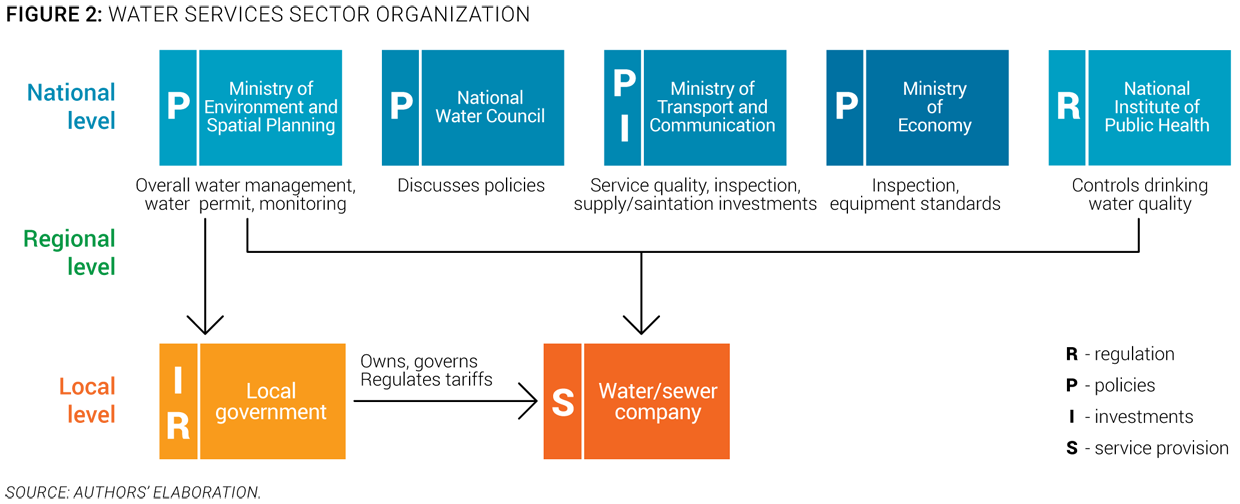
Policy-making and sector institutions. The sector is controlled at the national level, and the municipal administration performs some regulatory duties. As shown in Figure 2, local service providers are regulated and controlled by a constellation of national- and local-level stakeholders, the most important of which are:
- The Ministry of Environment and Spatial Planning, which is the line ministry responsible for overall management of all water resources and policies, including those related to water services, in coordination with the Ministry of Transport and Communication, the Ministry of Economy, and the Ministry of Health.
- The National Water Council, which is a group of 9 scientific and expert people in the field of water management proposed by relevant line ministers and sector professionals appointed by the government for a period of three years. It is in charge of issues related to water management, harmonization, and coordination of different needs and interests, and for proposing measures for conservation, protection, and the continuous improvement of water regimes.
- The Ministry of Transport and Communication, which is responsible for service quality, policies on connection to water and sanitation networks, investments, and inspection.
- The Ministry of Economy, which is in charge of monitoring the water metering devices used for measuring water volume consumption and, in cooperation with the Ministry of Environment and Spatial Planning, for the preparation of proposals for concessions for water use of mineral and thermo-mineral resources.
- The National Institute of Public Health, which is in charge of monitoring the quality of drinking water.
Capacity and training. The Association of Communal Service Providers (ADKOM) is the key player for training and capacity-building initiatives. It provides training, technical assistance, and knowledge exchange activities (workshops, conferences, journal) to water sector stakeholders. However, usually those capacity-building efforts are donor driven and on an ad-hoc basis. Since the water services management staff is appointed by locally elected politicians, it is often replaced according to political cycles. Hence, management staff turnover is relatively high. Faced with a high unemployment rate, municipal politicians usually see water utilities as an employment solution. Thus, overemployment and a questionable level of staff qualification are problematic in most service providers.
Economic regulation. Economic regulation is fully within local governments based on policies set at the national level. There is no single national regulator on waters and water services; however, ADKOM has undertaken the initiative to establish a national regulatory body. Economic regulation is based on the full cost recovery principle as stated in the “Methodology for determination of the price of drinking water and outflow of urban waste water,” introduced in 2005. Tariffs are calculated and proposed by utilities and approved by municipal councils. However, in practice, there are many examples of municipal councils not approving the proposed tariffs due to political and/or social reasons. Water tariffs barely meet the water companies’ operating and maintenance costs, and do not allow for upgrading or modernization of distribution networks, which significantly contributes to the unsustainability of the water companies.
Ongoing or planned reforms. The strategy to reform the communal sector was adopted by the Parliament in 2008, but it was never implemented. There are currently two main reform initiatives. One is under the umbrella of the Ministry of Environment and Spatial Planning in the context of the project, “Development of National Water Tariff Study,” funded by the European Union. The goal is to establish an economic instrument to implement the “polluter pays” principle in the water sector to ensure the financial and environmental sustainability of the sector and to support accelerated investment in infrastructure projects. The second was initiated by service providers through the national association (ADKOM) for establishing a national regulator of water services. One of the main if not the only reasons is that utilities can barely increase their tariffs, although operational costs are rising due to overemployment and energy prices.
ACCESS TO SERVICES

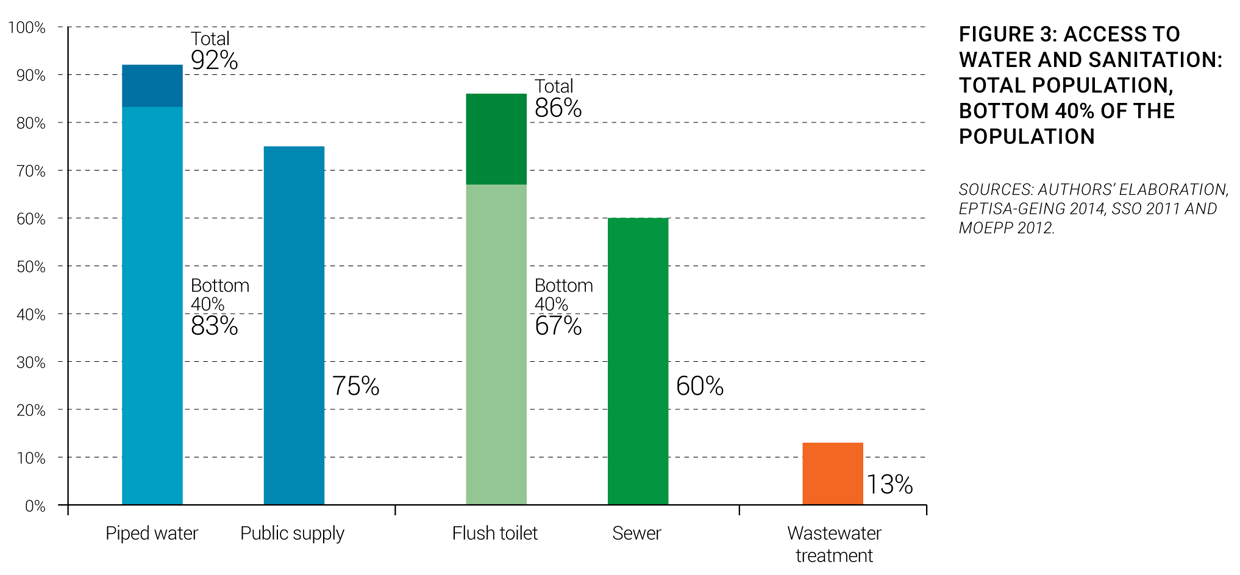
Service coverage. FYR Macedonia has traditionally had a high level of water supply service, and just a slightly lower level of sanitation services in rural areas. According to the UNICEF/WHO Joint Monitoring Program (JMP), over 98% of the urban population and about 80% of the rural population is connected to piped water supply systems. The same applies for access to sanitation services. Other sources show lower service coverage of 87% for water supply and about 86% for wastewater, on average, for both the urban and rural population (Figure 3). JMP calculations seem to be more realistic. However, access to wastewater treatment is much lower, at 13% of the population and 21% of the wastewater produced (MoEPP 2011).
Equity of access to services. Current water charges are below the average income threshold, but low-income households face increased problems. The average cost of water services to the average household is 1.7% of household income (SSO 2008), which is less than the affordability threshold of 3%, the benchmark in the water services sector in Europe. For the lowest-income quintile, the cost of water is already 6%, and for the second-lowest quintile, it is slightly above the 3% threshold, while the cost of the highest-income quintile is less than 1%. Approximately one-third of the poorest households in Roma settlements do not have access to improved water sources and/or sanitation (ERRC 2013). Some regional surveys show that the share of Roma who had outstanding payments for water, electricity, and other housing expenses is larger than the respective share of surveyed non-Roma households. This appears to be valid for FYR Macedonia also, where the largest gaps exist between Roma and non-Roma respondents in arrears for water (and electricity).
Macedonian Data Availability
There is currently no reliable, country-wide, publicly available source of information on water services performance in Macedonia. The Association of Communal Service Providers (ADKOM) recently launched a project supported by the Danube Water Program to establish an internal system for performance data collection from its members, which among others, is to be used for benchmarking, relying mostly on IBNET indicator definitions.
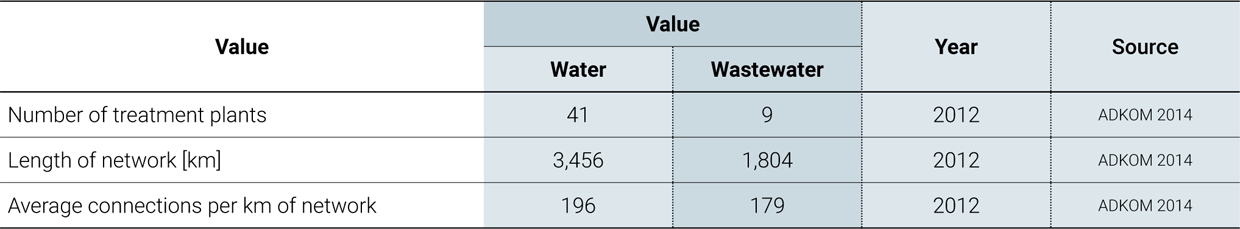
Service infrastructure. The Macedonian water and wastewater infrastructure needs upgrading. Most of the infrastructure was installed more than 50 years ago. The performance of the water network could be improved, since nonrevenue water is high, at about 63% (IBNet 2015). The water mains are almost twice as long as the sewerage network; there are 550 km in the storm water network for all pipe diameters. The density of water and sewerage connections is 196/km and 179/km, respectively (Expert estimate). Technical design and construction of infrastructure comply with the Macedonian, European, and International Organization for Standardization (ISO) standards. There are 9 wastewater treatment plants covering 13% of the population (MoEPP 2011). The expected deadline for full implementation of the Urban Wastewater Treatment Directive is 2026 for all agglomerations in less sensitive areas. Dates should be stricter for sensitive areas but are not yet defined. However, these seem to be optimistic estimations.
PERFORMANCE OF SERVICES
Service Quality
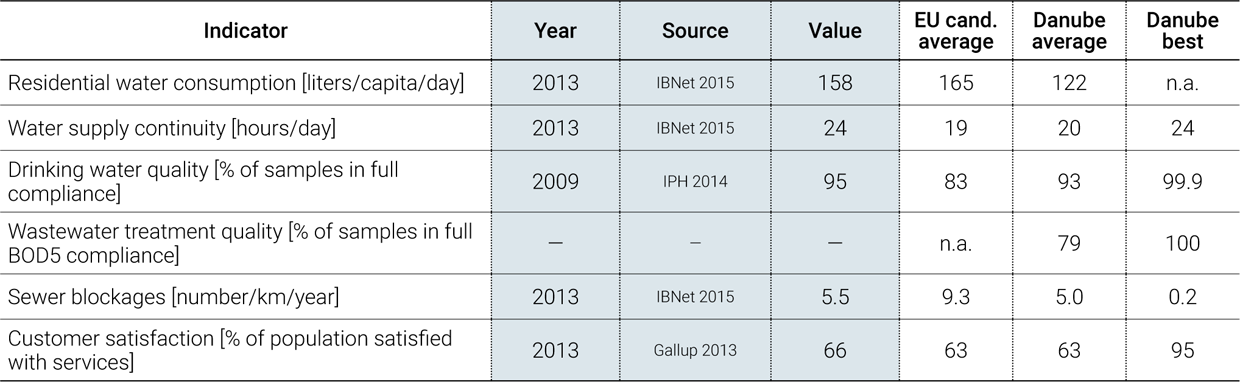
Quality of service. Service quality in FYR Macedonia is generally very good by regional standards. Water supply service is continuous, and drinking water quality is mostly in compliance with national/EU standards. However, 80% of wastewater volume is not treated, and effluent treatment quality is not yet measured in a consolidated and regular manner (MoEPP 2011).
Customer satisfaction. Sixty-six percent of the population is satisfied with the service provided in their city. This number is higher than in Serbia (61%), Albania (58%), and Bulgaria (52%), but lower than in Montenegro (72%) and Croatia (82%) ( Gallup 2013). Other locally conducted surveys show similar results. Longitudinal data for 2009-2013 show that citizens give water supply and sewage services an average mark of 3.2 (on a scale from 1 to 5). Similarly, 64% of households are satisfied and 11% are very satisfied with the water supply in their homes. Companies similarly express general satisfaction with water supply services, and only 8% of companies express dissatisfaction (FOSM 2015).
Efficiency of Services
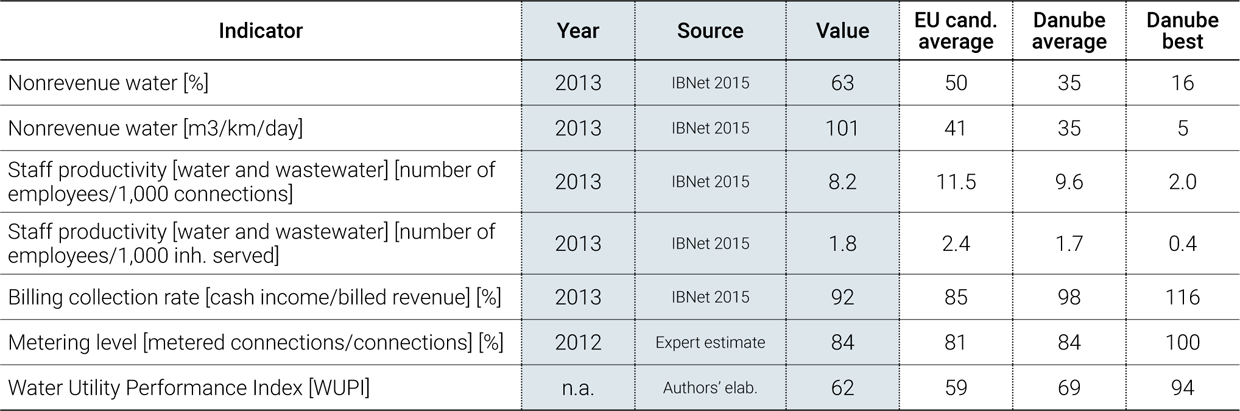
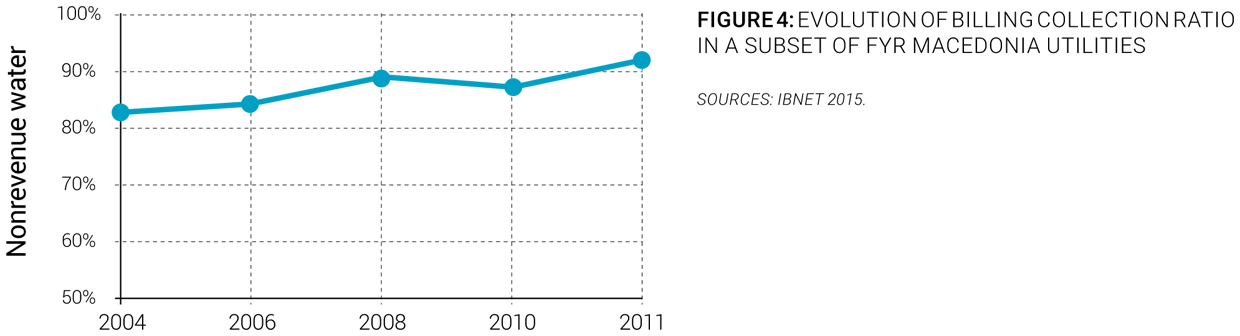
Overall efficiency. The efficiency of public water and sanitation service providers in FYR Macedonia, like in most of the public utilities in the region, is a serious issue. Results show that both technical and financial efficiency need urgent, immediate action. Nonrevenue water is almost equally distributed between commercial and technical losses, although the metering level is relatively high at an average of 84% (Expert estimate). The average number of pipe breaks is over 4 per km annually (IBNet 2015), compared to the standard benchmark of less than 0.5, and there are around 5.5 sewerage blockages per km annually (IBNet 2015), compared to the standard benchmark of less than 0.1 blockages. This indicates that the water supply and sewer networks are in very poor condition and that urgent reconstruction and replacement are necessary. Although the billing collection rate is relatively high at 92% (IBNet 2015), the collection period is over 420 days, which calls into question the financial and operational sustainability of utilities and their ability to settle their matured payables. With an average staffing of 8.2 per 1,000 connections, the sector is much less productive than international best practices of 1 to 2, but is in the range of the regional average (IBNet 2015). The limited productivity is largely a consequence of the atomization of the sector and of the direct control exerted by local government authorities over utility staffing and management.
Recent trends. No significant progress has been made on the efficiency agenda over the last 10 years. Most of the indicators mentioned above show no significant improvements except in the collection rate, which appears to have steadily increased, as shown in Figure 4.
FINANCING OF SERVICES
Sector Financing

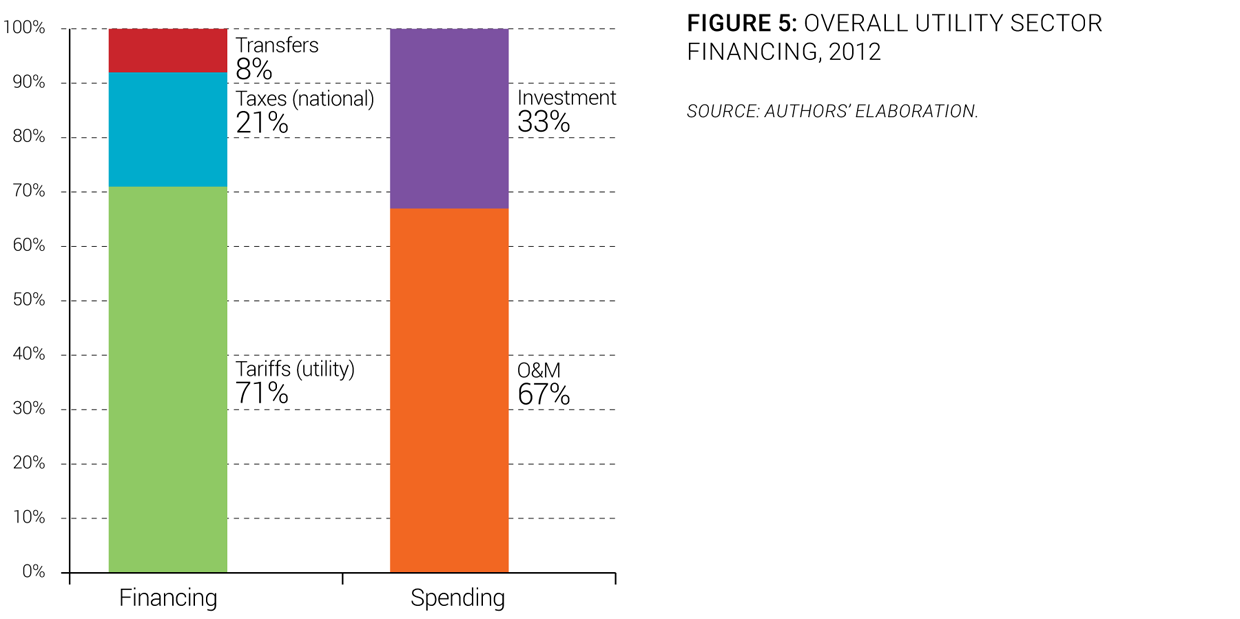
Overall sector financing. Tariffs fully cover operation and maintenance costs. They are the dominant source of funding in the sector (Figure 5), while national and municipal budgets and international grants are used for new investment funding. Tariffs are also meant to cover depreciation expenses, but usually part of water tariffs are used for other municipal expenditure in case of a local multi-utility company. In addition to water tariffs, utilities collect water abstraction (2%) and pollution (1%) fees (Bakllamaja and Hristov 2012). The collected funds feed into the central government budget and are used for various purposes. If the funds are not used during the budgetary year, they go to the Treasury. The total collected through these two fees is about €350,000 a year, which is a very low compared to the water abstraction and pollution investment needs. The main sources of funding of water and wastewater utilities are described in Figure 6 using the OECD three Ts methodology (tariffs, transfers, and taxes).
Investment needs. Over €0.5 billion euros (€20/capita/year) in investments are needed to comply with the EU acquis, which does not include the cost of rehabilitation and renovation of existing facilities (Eptisa-Geing 2014). Lower investments are planned for water supply, and major investment activities will be directed toward reconstruction and completing existing sewage network construction and new network and treatment plant construction. Wastewater management investment needs are broadly comparable with the values seen in recent EU accession countries (Eptisa-Geing 2014).

Investments. Preparations for infrastructure investment are lagging, and funding is low compared with sector needs. Current major investment levels in the sector are financed predominantly through loans from IFIs, notably KfW, the European Investment Bank, and the World Bank. Some investments are also provided by the EU Instrument for Pre-Accession (IPA) Component III (regional development). Total investments in 2013 amounted to €21 million, or slightly more than €10 per capita (Authors’ elaboration). Total planned investments from IFIs represent some €100 million for 2011-2015; however, implementation is progressing more slowly than planned (Figure 7). For national investment grants, the government has introduced criteria and procedures for allocating central budget funds to construction and maintenance of water supply and sewerage systems. This has resulted in increased grant allocations to underserviced and less developed municipalities.

Cost Recovery and Affordability

Cost recovery. Current tariffs do not provide full cost recovery for water supply and sanitation services, mainly due to the high operational inefficiency of utilities. There is no national operational subsidy scheme in place, but in some cases water providers receive operational subsidies from local governments. Also, cross-subsidies remain a de facto part of the “business model” of multipurpose utilities. The current approach to tariff setting whereby households pay a significantly lower price for water than nonhousehold consumers is another de facto cross-subsidy. Operating cost coverage is estimated at 1.05 (IBNet 2015). This indicates that companies barely manage to cover their costs with collected bills, and certain utilities are fully dependent on external financing. As shown in Figure 8, however, significant cross-subsidies between residential and industrial tariffs exist, with industrial tariffs up to 60% higher than residential tariffs.
Tariffs. In general, water tariffs have remained low and unchanged for an extended period of time, and vary considerably across the country. Over the last five years, water rates have been increasing, but the main problem is the application of the existing tariff methodology. That is, utilities do not need to regularly evaluate whether the tariffs cover operating costs, which delays necessary tariff increases, often for years, which favors municipal authorities that do not want to pay the perceived political costs of a tariff increase. Households pay an average rate (per m3) of €0.39 for water supplied, and legal persons pay an average of €0.60. Households and legal persons pay an average of €0.20 for sewerage services (ADKOM 2014). In the future, an increase in charges can be expected as a result of the new EU Water Framework Directive, which will require significantly higher investments, and higher operational expenditure associated.

Affordability. Affordability is not yet a constraint for most people, but it may become one for a segment of the population. The current potential average cost of water services represents 1.7% of household income (Authors’ elaboration), which is below the 3% benchmark in the water services sector in Europe. This in turn indicates the potential for gradually increasing tariffs without breaching the threshold.
WATER SECTOR SUSTAINABILITY AND MAIN CHALLENGES
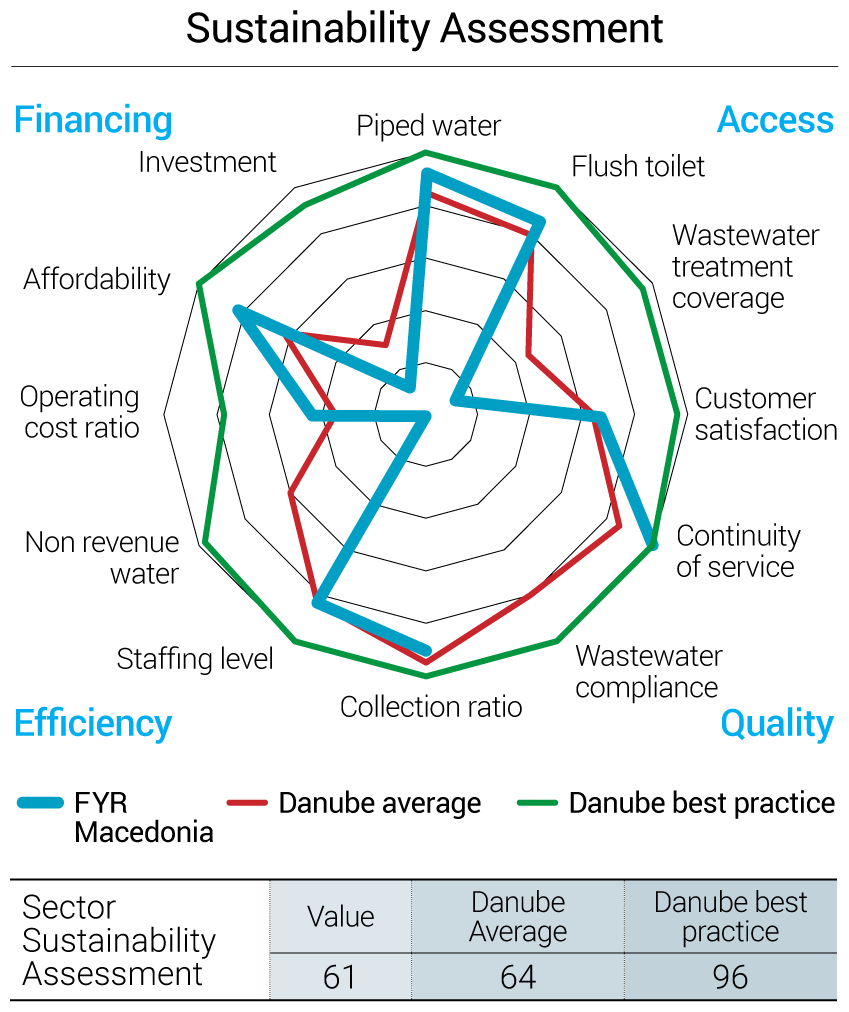
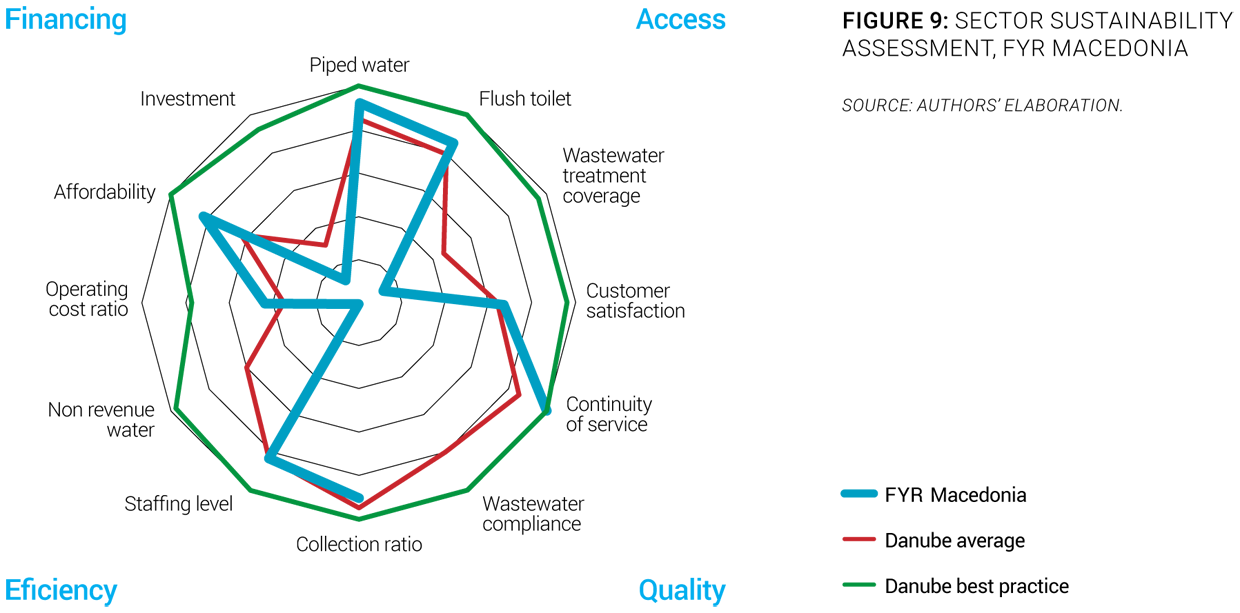
To evaluate the sustainability of services in the region, an overall sector sustainability assessment was done taking into account four main dimensions: access to services, quality of services, efficiency of services, and financing of services. Each of these dimensions is measured through three simple and objective indicators. For each indicator, best practice values are established by looking at the best performers in the region, and countries closest to those best performers are deemed to have a more mature sector. A more complete description of the methodology to assess sector sustainability is included in the Annex of the State of the Sector Regional Report from the Danube Water Program. The outcomes of this assessment for the FYR Macedonia water sector are presented in Figure 9, which also shows average and best practices in the Danube region. The Macedonian sector sustainability score is 61, which is below the Danube average of 64. The assessment shows that, on average, the country performs well in terms of access to piped water and flush toilets, continuity of service, staffing level, and affordability. The main deficiencies of the FYR Macedonia water sector identified through the sector sustainability assessment are investment level, operating cost ratio, wastewater treatment coverage, and the nonrevenue water level (Figure 9).
The main sector challenges are:
- Securing a multiyear investment budget. Although current tariffs cover operations and maintenance expenditures, this is at the expense of the part of the tariffs meant to cover depreciation costs. As a consequence, utility capacity to carry out replacement and renewal investment (but also preventive maintenance) is under threat. It is estimated that €20/capita/year in investments are needed to meet EU acquis requirements. These investments will have to be financed by the public sector (through local and national budgets) and international sources. Given the limitations of both local and central government investment capacity, improving the borrowing possibility at the utility or municipal level could be very important. Even if a significant amount can be financed through international loans or donations, co-financing is necessary for at least 25% to 35% of these investments.
- Improving the efficiency of service providers. Reducing nonrevenue water and introducing the use of contemporary information and communications technology, are needed to improve the efficiency of the sector and reach good practice levels. New legislation requires each network operator to establish an underground cadastre. This could bring additional challenges to water utilities, since they lack capacities (financial, human) and particularly technical data on their infrastructure. But this step could help utilities to implement effective maintenance and investment strategies to secure the sustainability of the sector. On the tariff-setting side, the “Methodology for Determination of the Price of Drinking Water and Outflow of Urban Waste Water” adopted in 2005 was a serious attempt to change the price-setting practice to full cost recovery practices. Price control by the government was abandoned and price setting became the sole responsibility of municipalities. However in practice, it appeared that few municipalities used the methodology to prepare their tariff submissions to the city councils, and there were only a few examples of tariff adjustments. In addition, in certain cases, political influence in the governance of utilities resulted in the reduction of certain tariffs. Establishing an effective tariff system is key to ensuring the sustainability of the sector.
- Implementing fully the existing water laws. Although the Law on Waters incorporates most EU water regulations and is well aligned with EU directives, in practice the water legislation is not fully applied, and its implementation remains modest. The lack of coordination among the competent authorities in the water sector continues to hamper implementation of the “polluter pays” and cost recovery principles. Moreover, the river basin management structure is not yet operational. There is no regular monitoring or publicly available data on urban wastewater quality. Wastewater producers have not installed and do not maintain measuring devices. Infrastructure investment is lagging and funding is low compared to sector needs. The European Commission Progress Report on FYR Macedonia for 2013 concluded that “significant efforts are needed to implement the legislation, especially in the areas of water management (…). Significant strengthening of administrative capacity, both at central and local level, is of the utmost importance. Investment needs to be significantly increased, especially in the waste and water sectors.”
SOURCES
- BADKOM. 2014. Utilities Sector Analysis in the Republic of Macedonia. Skopje: Association of Public Utility Service Providers of the Republic of Macedonia.
- Bakllamaja, A., and G. Hristov. 2012. Assessment of Investment Needs and Institutional Policy Measures Water and Waste Water Sector: Republic of Macedonia. Skopje: European Investment Bank.
- Eptisa-Geing. 2014. Development of National Water Tariff Study - Identification and Selection of Alternative Concepts for Economic Instrument. Skopje: EPTISA-Geing Consortium.
- ERRC. 2013. Macedonia - A Report by the European Roma Rights Centre - Country Profile 2011-2012. Budapest: European Roma Rights Centre.
- FAO Aquastat. 2015. Food and Agriculture Organization of the United Nations - AQUASTAT Database. Accessed 2015. http://www.fao.org/nr/water/aquastat/data/query/index.html?lang=en.
- FOSM. 2015. Foundation Open Society Macedonia. Accessed 2015. http://soros.org.mk.
- Gallup. 2013. World Poll. Accessed 2015. http://www.gallup.com/services/170945/world-poll.aspx.
- IBNet. 2015. The International Benchmarking Network for Water and Sanitation Utilities. Accessed 2015. http://www.ib-net.org.
- ICPDR. 2015. International Commission for the Protection of the Danube River. Accessed 2015. http://www.icpdr.org.
- IPH. 2014. Institute of Public Health of the Republic of Macedonia. Accessed 2015. http://www.iph.mk.
- MoEPP. 2011. Water Strategy for the Republic of Macedonia. Skopje: Ministry of Environment and Physical Planning of the Republic of Macedonia.
- SSO. 2008. Household Consumption in the Republic of Macedonia, 2008. Skopje: State Statistical Office of the Republic of Macedonia.
- —. 2011. Environmental Statistics. Skopje: State Statistical Office of the Republic of Macedonia.
- —. 2015. State Statistical Office of the Republic of Macedonia. Accessed 2015. http://www.stat.gov.mk.
- World Bank. 2015. World Development Indicators. Accessed 2015. http://databank.worldbank.org/data/views/reports/tableview.aspx.