 Slovenia
- Water Snapshot
- Context for Services
- Organization for Services
- Access to Services
- Performance of Services
- Financing of Services
- Water Sector Sustainability and Main Challenges
- Sources
WATER SNAPSHOT
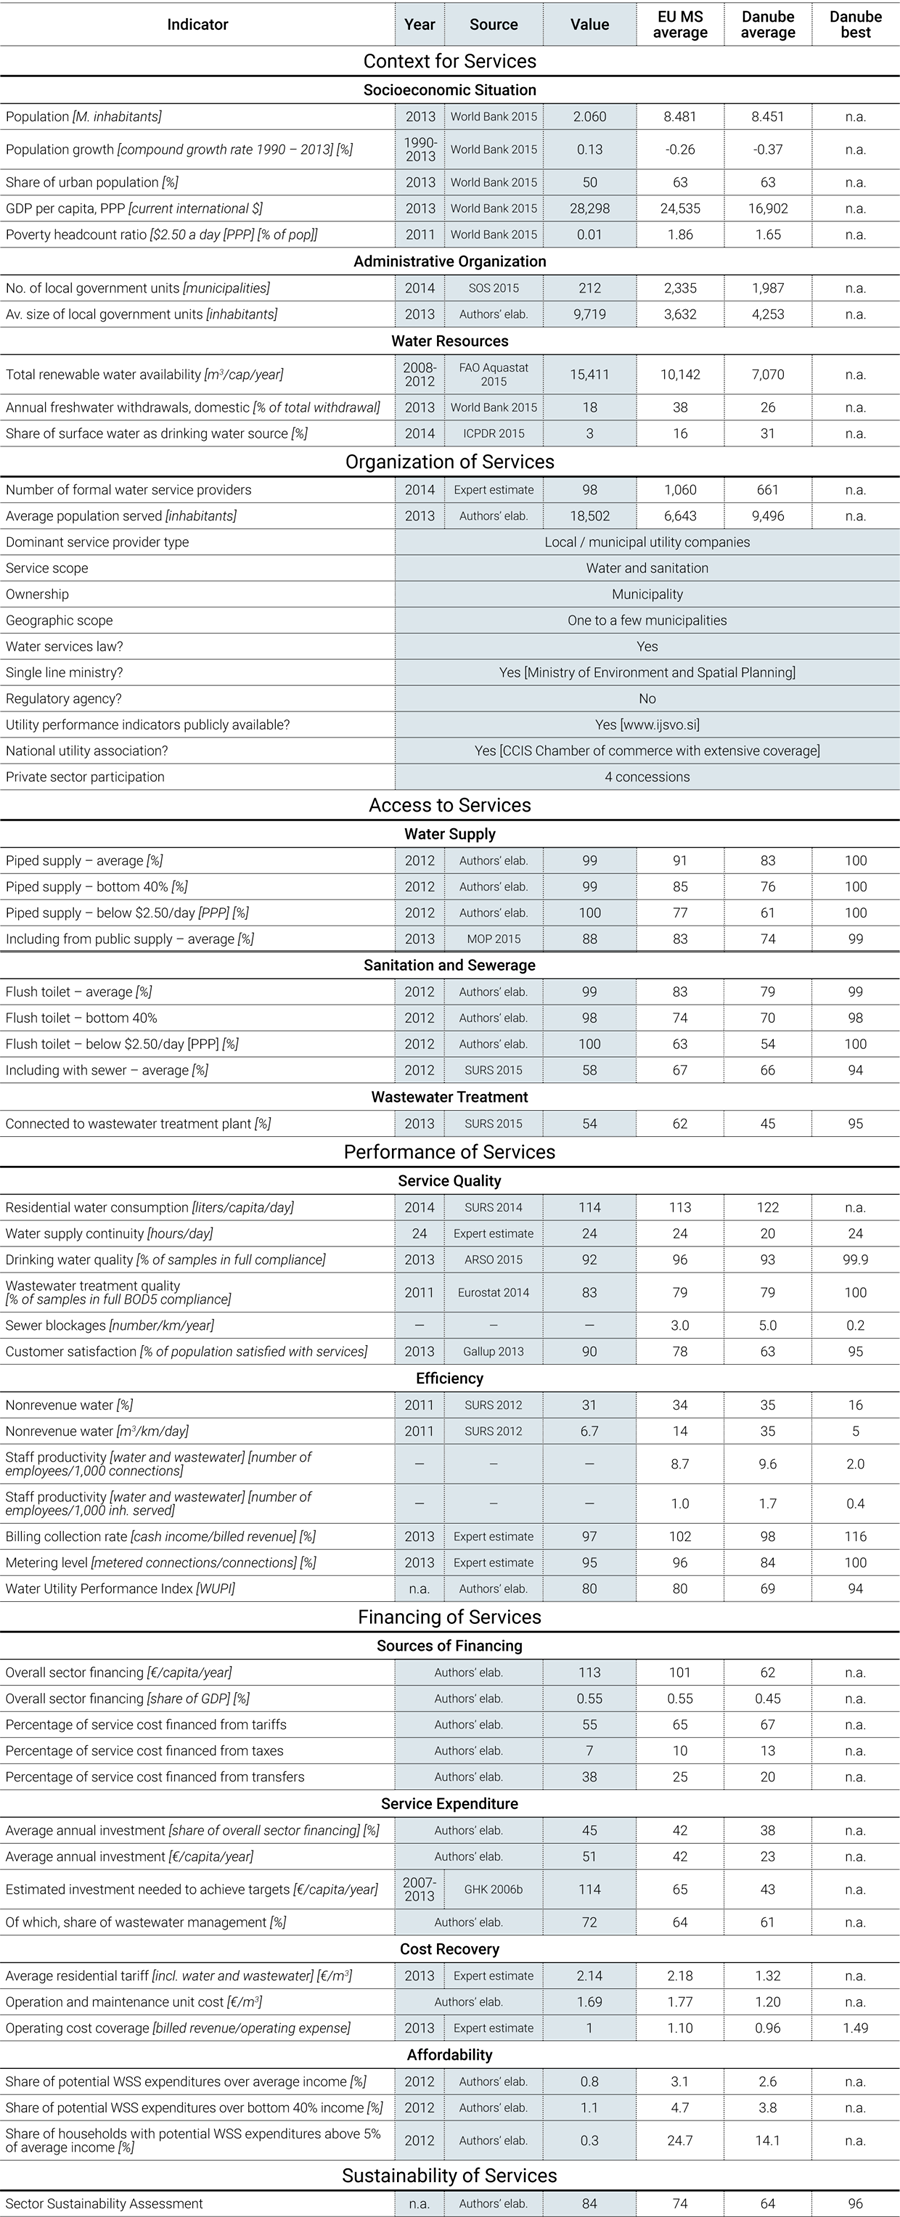
Sources for all numbers in the snapshot are provided in full in the body of this country page; a complete description of the methodology is provided in the State of the Sector Regional Report available under SoS.danubis.org/Report.
 |
 |
KEY WATER AND SANITATION SECTOR CHALLENGES
- Increasing the rehabilitation of the water infrastructure and improving its reliability. Although there has been much progress in the replacement and rehabilitation of the water and sanitation infrastructure, water losses in some utilities remain very high, evidence that more replacement work is needed. In addition, the hydrological drought of 2011-2012 proved that numerous water supply systems may experience serious problems in case of prolonged drought.
- Improving monitoring and reporting practices. The only effective monitoring system currently is the water quality monitoring scheme. There are no other utility performance monitoring and reporting systems, such as on water balance, water losses, and nonrenewable water. This makes monitoring of improvements in operational efficiency and sound economic management of water utilities almost impossible.
FURTHER RESOURCES
On water services in the Danube Region
- A regional report analyzing the State of Sector in the region, as well as detailed country notes for15 additional countries, are available under SoS.danubis.org
- Detailed utility performance data is accessible, if available, under www.danubis.org/database
On water services in Slovakia
The following documents are recommended for further reading; the documents, and more, are available at www.danubis.org/eng/country-resources/slovenia/
- Filippini, M., N. Hrovatin, and J. Zoric. 2008. “Cost Efficiency of Slovenian Water Distribution Utilities: An Application of Stochastic Frontier Methods.” Journal of Productivity Analysis 29 (2), 169-182.
- TC Vode. 2013. Market Sector Scan of Water Management of Slovenia. Ljubljana: TC Vode.
CONTEXT FOR SERVICES

Economy. Slovenia has been an EU member since 2004 and has one of the highest per capita GDPs in Central Europe. Slovenia has experienced one of the most stable political transitions in Central and South-Eastern Europe. However, long-delayed privatizations and an increasingly indebted banking sector have fueled investor concerns since 2012. The 2008-2009 economic crisis hit Slovenia especially hard in the real estate and construction sectors, and the unemployment rate rose to 13% in 2014, according to the Slovenia Statistical Office (SURS 2015). The country’s 2 million inhabitants are evenly distributed between urban and rural areas, but there are regional disparities between the wealthier and more developed central and western regions and the less developed eastern regions.
Governance. Public administration is organized at the national and municipal levels. Slovenia is a parliamentary republic composed of 212 municipalities. Local self-government units perform activities such as local spatial planning and development and provision of local public services including water and wastewater services.
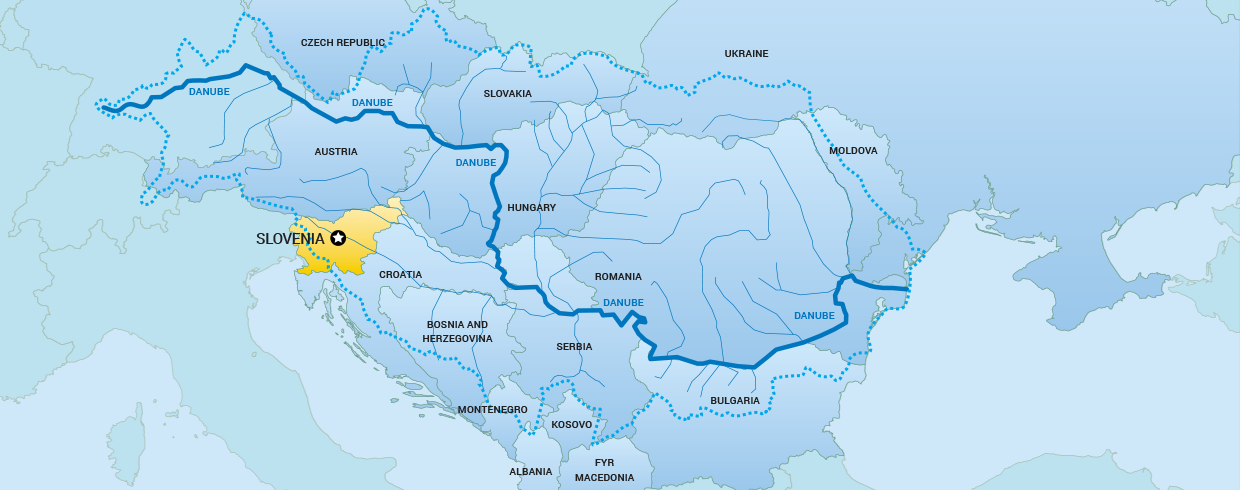
Water resources. Slovenia has good-quality and sufficient water resources. Eighty-one percent of the Slovenian territory belongs to the Black Sea basin, and the rest is part of the Adriatic Sea basin (ICPDR 2010). With 15,411 m3/capita/year, there are sufficient quantities of water on average in Slovenia, and most of it is in a good ecological state. However, agriculture has had a severe impact on groundwater quality, and there is a concern about the decreasing groundwater level in certain areas due to overabstraction. Industrial and domestic pollution of surface water is present in the Sava River and in coastal waters, where heavy metals and toxic chemicals threaten water quality. Runoff and river flow characteristics have changed significantly due to urbanization, transportation, and construction of hydropower plants. As a result, floods, especially flash floods due to hilly terrain, are more frequent and more intense, causing extensive material damage to infrastructure (including water and wastewater assets) and concerning more than 15% of the country’s territory (ICPDR 2010). Due to the increasing concentration of population located at the bottom of basins and broad valleys (where almost two-thirds of Slovenes reside), a significant share of the population now lives in areas exposed to floods. This is the case for both rural and urban settlements. Climate change is expected to reinforce flood and drought frequency and amplitude. However, no action plan has been implemented.
Water supply sources. Drinking water supply relies almost exclusively on groundwater. Surface water is predominantly used for the production of electric energy in hydroelectric power stations, while groundwater provides 97% of the raw water for potable public supply (ICPDR 2015). Industry is another significant user of water. Only a small share of water consumption is used for agriculture, tourism, services, and fish farming. The major source of surface water pollution comes from point sources (emissions from industrial and communal wastewaters and rainwater from urbanized areas). In still or slow-flowing surface waters, the occurrence of eutrophication due to excessive amounts of nutrients is a significant problem. Groundwater is mostly susceptible to diffuse pollution from agriculture and urbanization, which is most pronounced in the very north-eastern part of Slovenia. Critical pollutants significantly contributing to this pollution are desetilatrazine, nitrates, and atrazine. Concentrations of atrazine and desetilatrazine are generally declining, however, due to the ban on their use (ICPDR 2010). Karstic characteristics of more than one-third of the Slovene territory result in specific management issues for water utilities, such as turbidity and risks of microbiological contamination in case of intensive precipitation or difficulties managing drinking water protection zones (ICPDR 2010).
ORGANIZATION FOR SERVICES
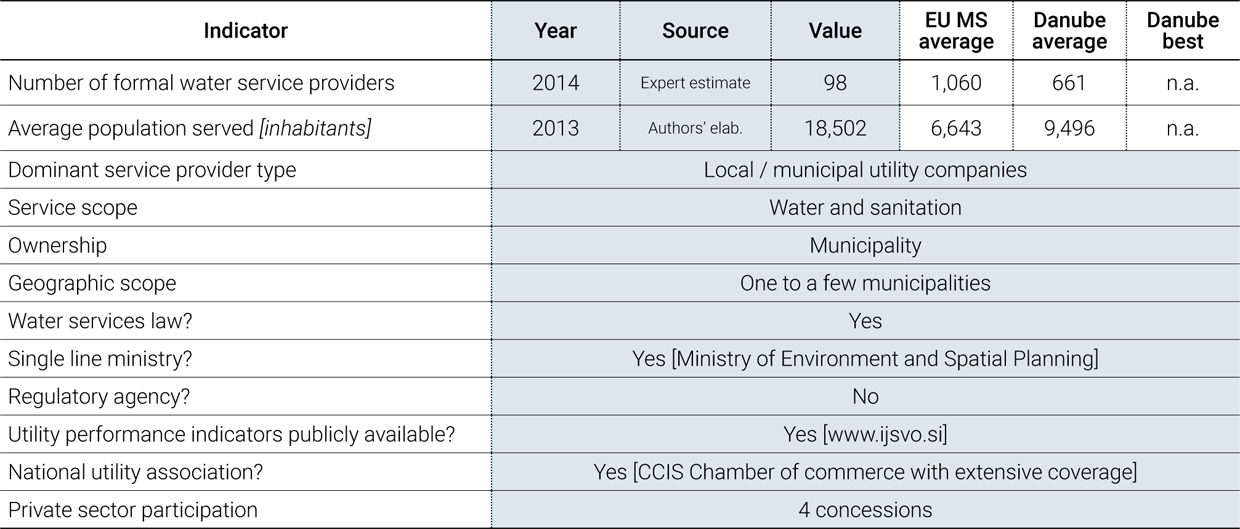

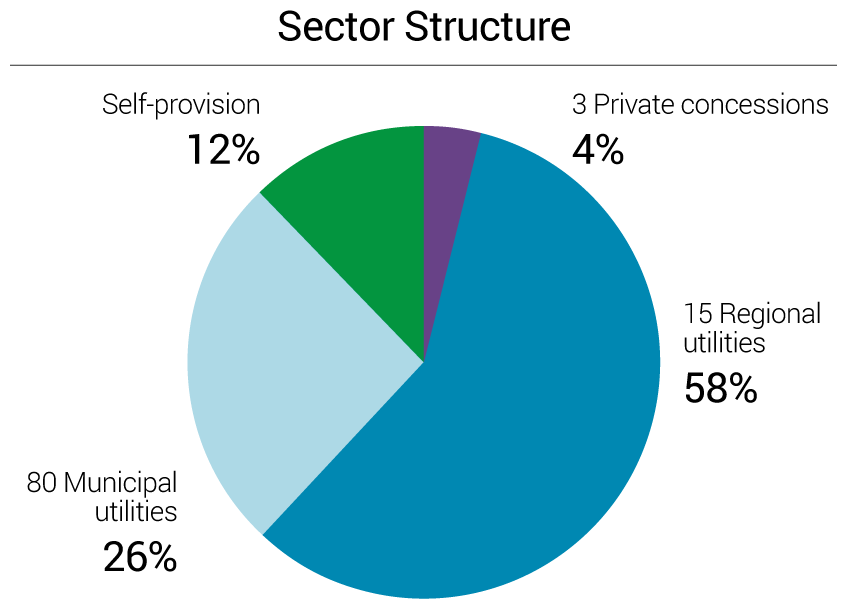
Service provision. Local government units provide water and sanitation services through 98 utilities. Fifteen regional water and sanitation utilities serve 58% of the population. Eighty medium and small municipal water utilities serve about 26% of the population. The rest of the population, mainly located in rural areas, relies on self-provision (12%). Three private operators provide water and sanitation services to 7 municipalities (Figure 1).
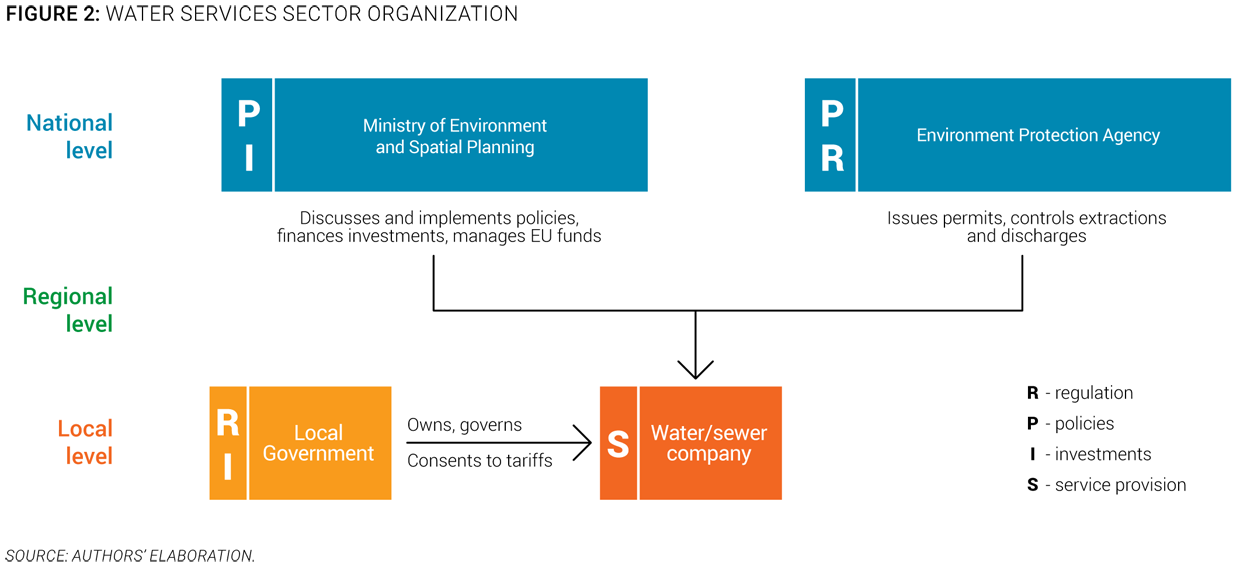
Policy-making and sector institutions. The regulation of the water sector is centralized at the national level. There are two national entities in charge of water sector regulation in Slovenia (Figure 2):
- The Ministry of Environment and Spatial Planning, which is the line ministry responsible for water sector policy development and implementation. It is in charge of regulatory benchmarking, and finances investments and manages EU Cohesion Funds (MOP 2015a).
- The Environment Protection Agency, which is responsible for issuing water abstraction permits and for water resources management and allocation. It is also responsible for monitoring water resources quality and quantity, collecting water abstraction and pollution taxes, and protecting drinking water intake zones (ARSO 2015).
Capacity and training. Staff capacity building and training is an important issue in the water sector. Water services management staff is appointed by municipal representatives, and political influence is exerted on the utility management board. However, turnover according to political cycles is not necessarily the rule. Staff training has mainly been driven by individual initiatives from water utilities, which are largely undocumented and one-off. The lack of well-trained technical and financial personnel has led to inefficiency in the technical operations and financial management of some water utilities. Thus, there is room for improvement of staff training and for development of staff capacity in the water sector. The national water association does not currently provide training or technical assistance to water stakeholders.
Economic regulation. Local government units are in charge of service quality and tariff setting. The water sector in Slovenia is regulated through a public self-regulated model, since there is no national regulatory agency. A partial benchmarking approach has been adopted by the Ministry of Environment, but it is not being used as an economic regulatory tool (MOP 2015a). Service quality and tariff setting are the responsibility of municipalities, which must follow a mandatory methodology spelled out in a decree issued in January 2013. This new pricing mechanism is based on the cost recovery principle. Tariffs are revised on an annual basis by utilities and must be approved by municipal councils. Prior to this decree, water tariffs were controlled by the central government and were kept very low.
Ongoing or planned reforms. There has recently been little change in the water supply sector. Many water utilities in urban areas have been in continuous operation for more than a century. After the transition process in the 1990s, the number of municipalities increased from 60 to 212, and the number of water services increased to 98 utilities. Prompted by the EU integration process, large investments were made to improve wastewater collection and treatment, and to a lesser extent to enhance water supply. Currently, however, there are no significant institutional reforms ongoing in the sector.
ACCESS TO SERVICES
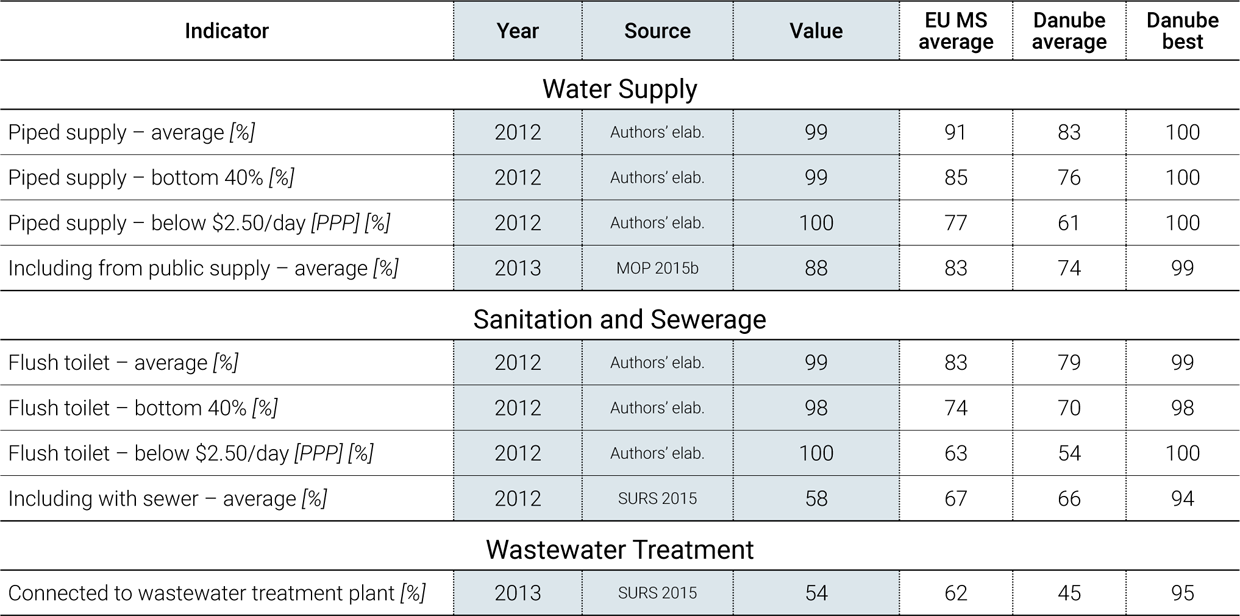
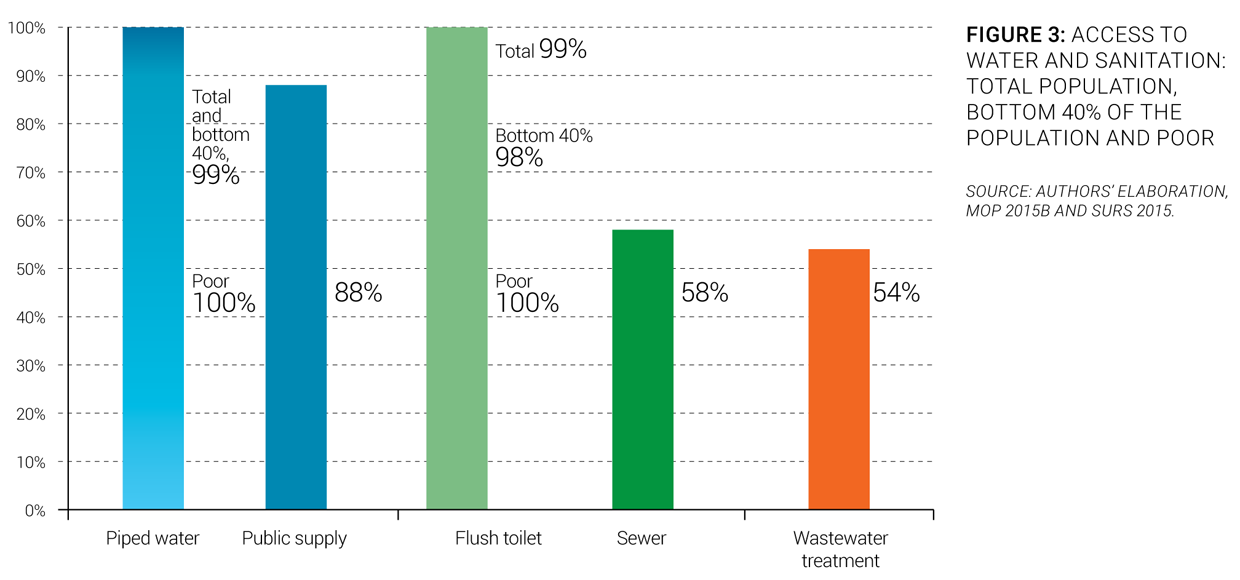
Service coverage. Slovenians have full access to water services. Ninety-nine percent of the Slovenian population has access to piped water and flush toilets (Figure 3). Eighty-eight percent has access to public piped water supply and 58% to piped sewer systems. Only 54% of wastewater discharged from sewage systems is treated.
Equity of access to services. Marginalized groups have fairly good access to water supply and sanitation facilities. Indeed, 100% of the poorest share of the population (living on less than $2.50 a day) reportedly has access to piped water and flush toilets, although no specific study about service coverage of ethnic minorities has been performed.
Data Availability
There are almost no data available on the efficiency of water utilities. As a result, it is difficult to assess the overall performance of the sector.
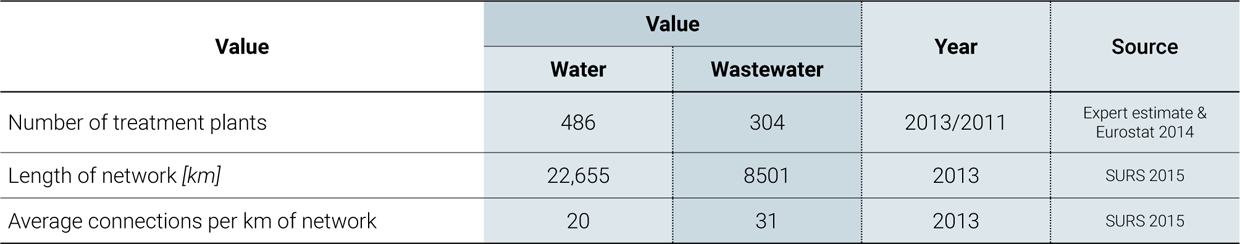
Service infrastructure. One-fourth of the Slovenian water network was installed before 1920. From 2000 to 2010, the rehabilitation of water supply systems was boosted by EU grants and funding specifically dedicated to water infrastructure improvement. Slovenian water pipes are made of polyethylene high-density (PEHD) (53%), of polyvinyl chloride (PVC) (10%), cast iron (8%), or asbestos and cement (10%). This latter material (now discarded in modern water systems) is liable to cracking and leakage. Among the 486 water treatment plants, 72% rely on chlorine disinfection and 13% on mechanical and chemical treatment.
PERFORMANCE OF SERVICES
Service Quality
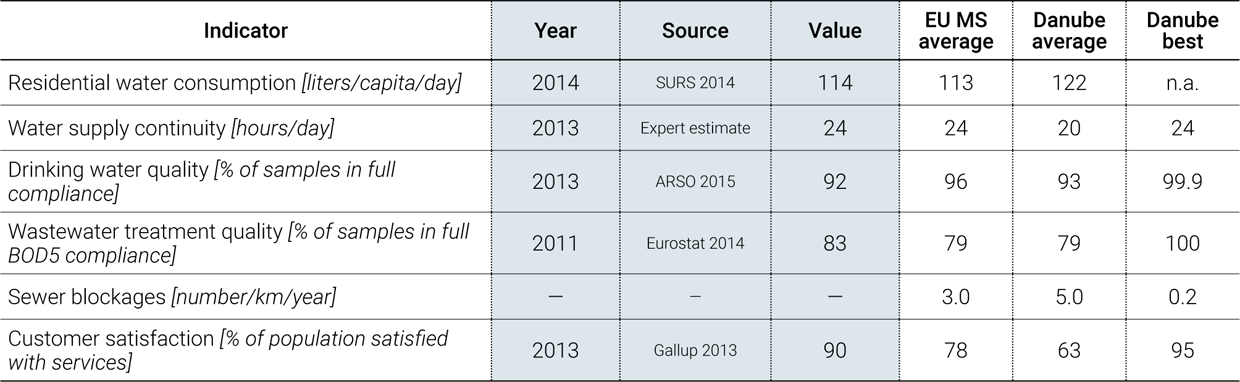
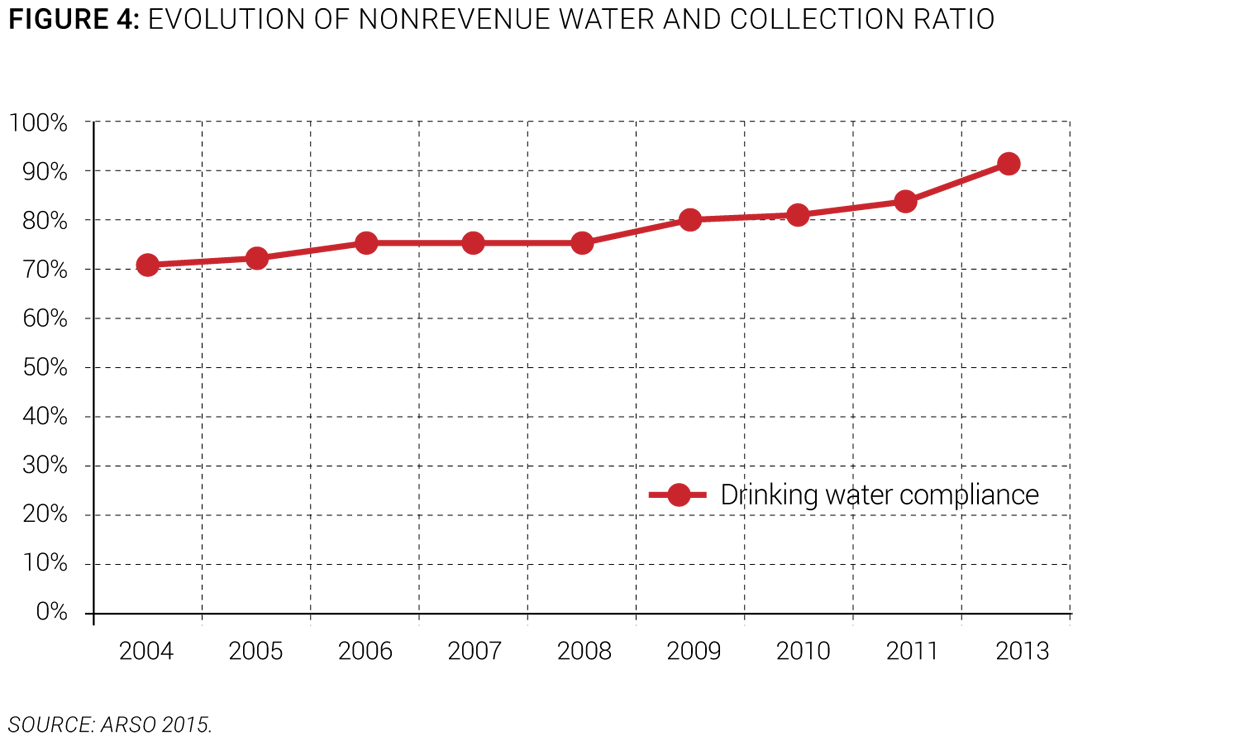
Quality of service. Drinking water quality in Slovenia improved during 2004-2013 for both microbiological and chemical parameters. The compliance rate has steadily increased over the last decade to 92% in 2013 (Figure 4). However, there are still some potable water quality issues in small settlements. Average water consumption is 114 liters per day and service is continuous throughout the day.
Customer satisfaction. The satisfaction of the population with the service provided in their city is very high, at 90% (Gallup 2013), higher than in most countries in the region.
Efficiency of Services
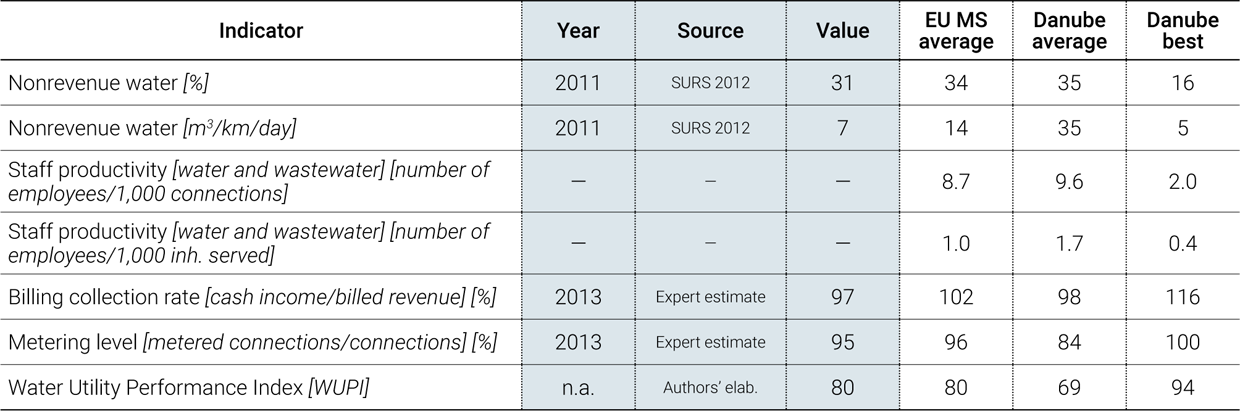
Overall efficiency. Because there are few data on efficiency, a proper assessment of the efficiency of the water sector cannot be made. However, we can say that in 2012, nonrevenue water amounted to 31% or 7 m3/day/km, in line with most countries in the region. The metering level is high at 95%. There are no data regarding staff productivity.
Recent trends. The evolution of the efficiency of the water sector cannot be analyzed due to lack of data. No information regarding the evolution of the efficiency of utilities is available. The water sector needs to be better assessed and monitored in order to monitor future improvement in efficiency.
FINANCING OF SERVICES
Sector Financing
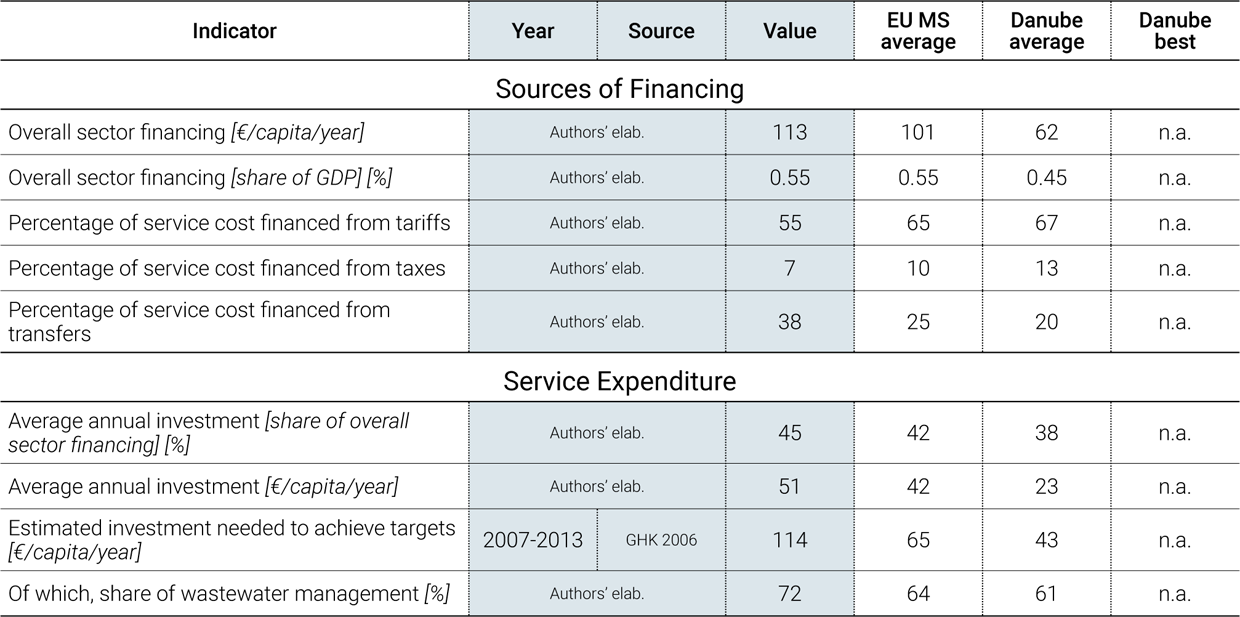

Overall sector financing. Tariffs only cover operation and maintenance costs (Figure 5). Investments, which represent less than half of sector costs, are mainly funded by EU funds and are augmented by subsidies from national and municipal budgets. Seventy-two percent of investments go to sanitation projects and 28% to waterworks.
The main sources of funding of water and wastewater utilities are described in Figure 6 using the OECD three Ts methodology (tariffs, transfers, and taxes).


Investment needs. To meet investment needs, the annual per capita capital expenditure would have to triple. At present, investments are needed for the renovation of existing water infrastructure and to reduce water leakage. In the Operational Program for Urban Waste Water Drainage and Treatment, the investments in wastewater management from all financial sources (EU funds, the national budget, the local community budget, and the environmental water pollution tax) for 2009-2015 are estimated at around €1.6 billion, or approximately €266 million per year or €114 per capita per year.
Investments. Current investments in the water and sanitation infrastructure mainly rely on EU Cohesion Funds. In Slovenia, regional policy and measures are implemented by 12 regional development agencies within the framework of the Operational Programme for Strengthening Regional Development Potentials (OPSRDP) (SVRK 2007a). The country is also entitled to receive EU Cohesion Funds under the framework of Operational Programme of Environment and Transport Infrastructure Development (OPETID) (SVRK 2007b). In addition to these programs and associated funding, a Water Fund, managed by the Ministry of Environment and receiving its funds from water resources rights, can be used to finance investments in water infrastructure; construction of public and local infrastructure to meet water infrastructure requirements; and for intermunicipal and regional projects for the purpose of constructing facilities for the pumping, filtering, and capturing of water for construction of movable water distribution systems for drinking water supply.
From 2007 to 2013, €555 million (€462 million from the OPETID, comprised of €393 million from EU funds and €69 million from the national budget), and €93 million from OPSRDP (comprised of €77.5 million from EU funds and €15.5 million from local contributions) was available for water infrastructure investments, and €187 million was available for wastewater infrastructure investments (comprised of €54 million from OPSRDP and €133 million from OPETID), with an additional €103 million from EU funds and €30 million from the national budget. This represented an average capital expenditure of €51 per capita per year (Figure 7). No information is available regarding how these grants were actually spent.
Cost Recovery and Affordability
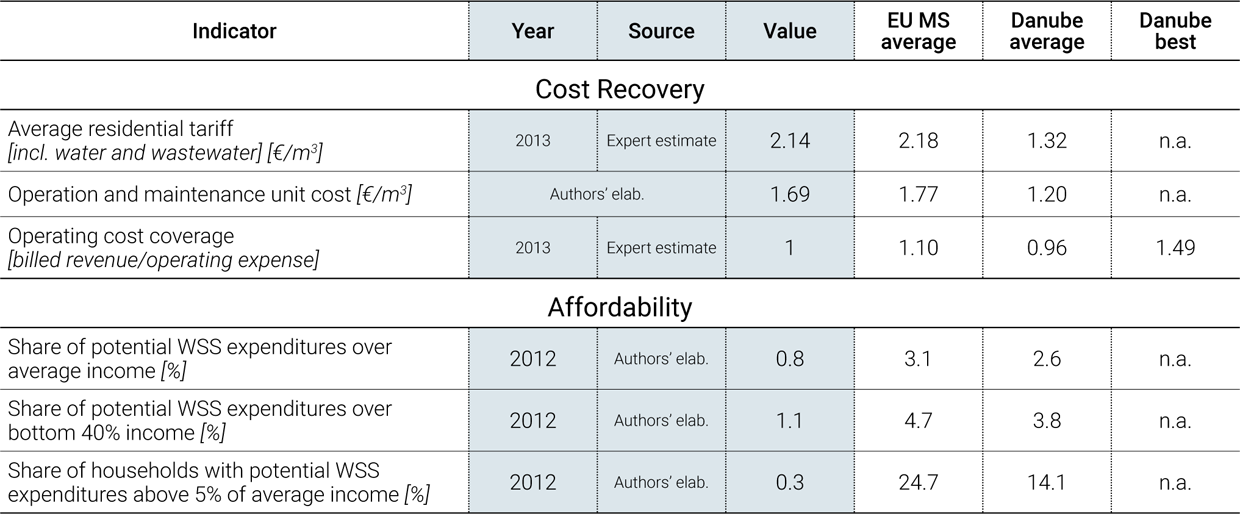
Cost recovery. Utilities only recover operation and maintenance costs through tariffs. With water tariffs controlled by the central government until January 2013, water utilities struggled to generate adequate revenues to cover their costs. According to the national legislation on water tariff setting, local government units can partially subsidize the water price using their municipal budget. However, this option is not often used.

Tariffs. Water tariffs are composed of a fixed and a variable fee and amount to an average of €2.14/m3. According to the January 2013 decree, the water tariff comprises a fixed charge for service availability, which is set depending on the meter diameter, and a volume charge proportionate to water consumption. This tariff structure is uniform for all categories of water users (households, public institutions, industry). However, in specific cases, very large industries can directly negotiate water tariffs with the local public provider. The average water price is €0.98/m3, including the fixed charge. The average sanitation price is €1.16/m3,including the fixed charge. Water prices can vary depending on conditions under which the water is supplied in Slovenia’s regions. Some areas benefit from abundant and qualitative water resources, which are supplied through a gravity conveyor system at very low production costs, whereas in other regions (especially karstic ones), water must be transported over long distances, with notable pumping costs and high potable treatment costs.
Affordability. The water and sanitation tariff does not currently trigger any affordability issues. The share of water and wastewater expenses in average household income has remained stable over time at 0.8% in both 1996 and 2013. For the bottom 40%, potential water expenses are 1.1% of household income, which does not trigger an affordability issue at present (Figure 8).
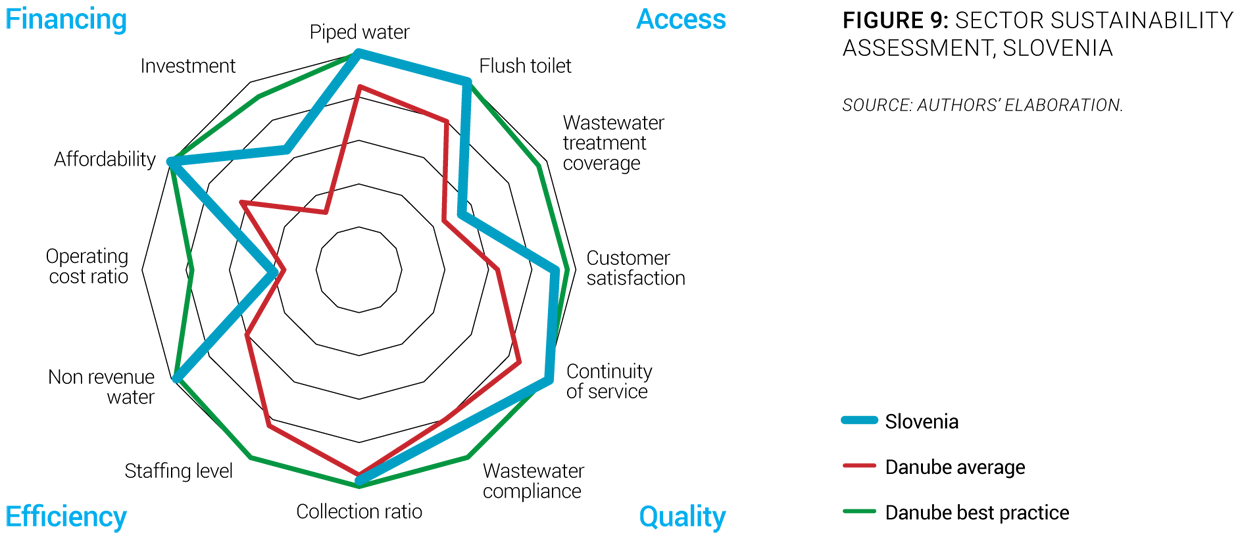
WATER SECTOR SUSTAINABILITY AND MAIN CHALLENGES
To evaluate and reflect the sustainability of services in the region, an overall sector sustainability assessment was done, taking into account four main dimensions: access to services, quality of services, efficiency of services, and financing of services. Each of these dimensions is measured through three simple and objective indicators. For each indicator, best practice values are established by looking at the best performers in the region, and countries closest to those best performers are deemed to have a more mature sector. A more complete description of the methodology to assess the sector sustainability is included in the Annex of the State of the Sector Regional Report from the Danube Water Program. The outcomes of this assessment for the Slovenia water sector are displayed in Figure 9, which also shows average and best practices in the Danube region. The Slovenian sector sustainability score is 84, which is above the Danube average sustainability score of 64. The assessment shows that, on average, the country performs well in terms of access to piped water and flush toilets, affordability, continuity of service, customer satisfaction, nonrevenue water, and collection ratio. The main deficiencies of Slovenia’s water sector identified through the sector sustainability assessment are wastewater treatment coverage, operating cost ratio, and investment level (Figure 9).
The main sector challenges are:
- Increasing the rehabilitation of the water infrastructure and improving its reliability. Although there has been much progress in the replacement and rehabilitation of the water and sanitation infrastructure, water losses in some utilities remain very high, evidence that more replacement work is needed. The funding required must be secured. In addition, the hydrological drought of 2011-2012 revealed that numerous water supply systems may experience serious problems in case of prolonged drought. The reliability of the water supply under extreme hydrological conditions needs to be improved.
- Improving monitoring and reporting practices. The only effective monitoring system currently is the water quality monitoring scheme. There are no other utility performance monitoring and reporting systems, such as on water balance, water losses, and nonrenewable water. This makes monitoring of and improvements in operational efficiency and sound economic management of water utilities almost impossible.
Slovenian Waters
In 2009, a public registry of water supply systems (called IJSVO) and a cadaster of public water supply infrastructure were developed. These tools are now in use and have improved the analytical information on the overall status of water supply in Slovenia. Thus, it is now possible to access information on water supply from the agglomeration level to the level of individual building and supply pipe. Improvements regarding data quality and validation are still necessary, but these registries are, nevertheless, key tools in the overall management of the water supply sector.
SOURCES
- ARSO. 2015. Slovenian Environment Agency. Accessed 2015. http://www.arso.gov.si/en.
- Eurostat. 2014. European Commission Directorate-General Eurostat: Statistics Explained - Water Statistics. Accessed 2015. http://ec.europa.eu/eurostat/statistics-explained/index.php/Water_statistics.
- FAO Aquastat. 2015. Food and Agriculture Organization of the United Nations - AQUASTAT Database. Accessed 2015. http://www.fao.org/nr/water/aquastat/data/query/index.html?lang=en.
- Gallup. 2013. World Poll. Accessed 2015. http://www.gallup.com/services/170945/world-poll.aspx.
- GHK. 2006. Strategic Evaluation on Environment and Risk Prevention under Structural and Cohesion Funds for the Period 2007-2013 - National Evaluation Report for Slovenia. Brussels: GHK Consulting Ltd.
- ICPDR. 2010. Danube Facts and Figures: Slovenia. Vienna: International Commission for the Protection of the Danube River.
- —. 2015. International Commission for the Protection of the Danube River. Accessed 2015. http://www.icpdr.org.
- MOP. 2015a. Ministry of the Environment and Spatial Planning of the Republic of Slovenia: Areas of Work - Water. Accessed 2015. http://www.arhiv.mop.gov.si/en/areas_of_work/water.
- —. 2015b. Ministry of the Environment and Spatial Planning of the Republic of Slovenia - National System for Public Service Performance. Accessed 2015. http://www.ijsvo.si.
- SOS. 2015. Association of Municipalities and Towns in Slovenia: Municipalities. Accessed 2015. http://skupnostobcin.si/obcine.
- SURS. 2012. Statistical Yearbook 2012. Ljubljana: Statistical Office of the Republic of Slovenia.
- —. 2014. Water - From the Source to the Outflow. Ljubljana: Statistical Office of the Republic of Slovenia.
- —. 2015. Statistical Office of the Republic of Slovenia: Data Base. Accessed 2015. http://www.stat.si/statweb/en.
- SVRK. 2007a. Operational Programme for Strengthening Regional Development Potentials for Period 2007-2013. Ljubljana: Government Office for Development and European Cohesion Policy of the Republic of Slovenia.
- —. 2007b. Operational Programme of Environmental and Transport Infrastructure Development for the Period 2007-2013. Ljubljana: Government Office for Development and European Cohesion Policy of the Republic of Slovenia.
- World Bank. 2015. World Development Indicators. Accessed 2015. http://databank.worldbank.org/data/views/reports/tableview.aspx.