 Austria
- Water Snapshot
- Context for Services
- Organization for Services
- Access to Services
- Performance of Services
- Financing of Services
- Water Sector Sustainability and Main Challenges
- Sources
WATER SNAPSHOT
Sources for all numbers in the snapshot are provided in full in the body of this country page; a complete description of the methodology is provided in the State of the Sector Regional Report available under SoS.danubis.org/Report.
 |
 |

Key Water and Sanitation Sector Challenges
-
Reducing pollution of water resources used for drinking purposes. Groundwater resources, which are the drinking water resources, face elevated levels of nitrate and pesticides in some regions. The protection of resources against pollution due to the agricultural sector and the industry is an ongoing challenge.
-
Adapting to climate change. Adaption of the sewer systems to manage heavier rainfalls due to climate change will be an important challenge to meet in the near future.
-
Improving asset management. During the last decades huge amounts of money have been invested into the water supply and wastewater sectors. It is important to maintain these assets to stay on a stable good practice level of service. Rehabilitation of existing infrastructure has been identified as a priority, and a strategy has been planned for 2012-2021.
Further resources
On water services in the Danube Region
- A regional report analyzing the State of Sector in the region, as well as detailed country notes for15 additional countries, are available under SoS.danubis.org
- Detailed utility performance data is accessible, if available, under www.danubis.org/database
On water services in Austria
The following documents are recommended for further reading; the documents, and more, is available at www.danubis.org/eng/country-resources/austria
- BMG. 2015a. Austrian Drinking Water Report 2011-2013. Vienna: Austrian Federal Ministry of Health.
- BMLFUW. 2010. National Water Management Plan 2009 - NGP 2009. Vienna: Austrian Federal Ministry of Agriculture, Forestry, Environment and Water Management.
- —. 2014a. Austrian 91/271/EEC Urban Waste Water Treatment Report 2014. Vienna: Austrian Federal Ministry of Agriculture, Forestry, Environment and Water Management.
Context for Services

Economy. Austria, a country with a high standard of living, has been a member of the EU since 1995. Austria has close to 8.5 million inhabitants, according to the 2014 census. Sixty-six percent of the population lives in urban settings, and the country is densely populated, with 102 inhabitants/km2 (World Bank 2015). GDP per capita is $44,149 (in current international dollars), making Austria a high-income country (World Bank 2015). The overall economic situation is good, with unemployment around 6%, but the Gini coefficient is 27.0, which means that a significant share of wealth belongs to only a small percentage of the population. The lowest 50% of households own only 4% of the property.
Governance. Austria has three administrative levels (national, regional, local). The central government consists of 13 ministries (BKA 2015), which are responsible for national legislation. Regional ministers administrate the regional money for their specific departments, and supervise the adjoined authorities. The country is divided into 9 regional state administrations, which enforce and implement national laws, and which are legislatively responsible for, for example, land use, construction legislation, and environmental protection. There are 95 administrative districts throughout the country that are integrated into the regional administration within district authorities (Statistics Austria 2015). On the third level, 2,354 self-administrated Austrian municipalities are responsible for local compliance with regional laws. Regions oversee municipal fulfilment of their duties, among which are provision of water supply and wastewater treatment.
Water resources. Austria is rich in high-quality drinking water resources. Austria has both a very good hydrogeological situation, with the Alps and the alpine headwaters of the Danube, and a long history of water resource protection of both groundwater and surface water. Large areas of the country can be supplied with native drinking water from springs and wells that are available in great quantity and quality for the resident municipalities. Some flat parts of Austria are affected by lower precipitation, which led to the establishment of water boards owned by the connected municipalities to solve quantity problems and partial overuse of local aquifers. In these areas, there is the need for some coordination among other stakeholders, like agriculture or the mineral raw material industry, with respect to groundwater quality. Water associations have been established over the last 100 years to balance the interests among those stakeholders and to prevent exhausting the resource. All climate scenarios until 2050 show only a small change in precipitation over the year. However, differences between areas have been spotted, and areas with lower yearly precipitation are expected to have even less precipitation in the future. Based on this knowledge, and due to general (technical) secure supply issues, the water supply systems became more and more interconnected through pipes and through cooperatives. Because of the high general availability of water in Austria, no water shortage is expected. Water supply for households and industry is seen as secure.
Water supply sources. Austria meets its drinking water demand with spring water and groundwater. Surface water is not used. Overall water availability is approximately 77.7 Bm³ per year (FAO Aquastat 2015). Austrian water suppliers extract about 800 Mm³ per year for Austrian drinking water.
Organization for Services
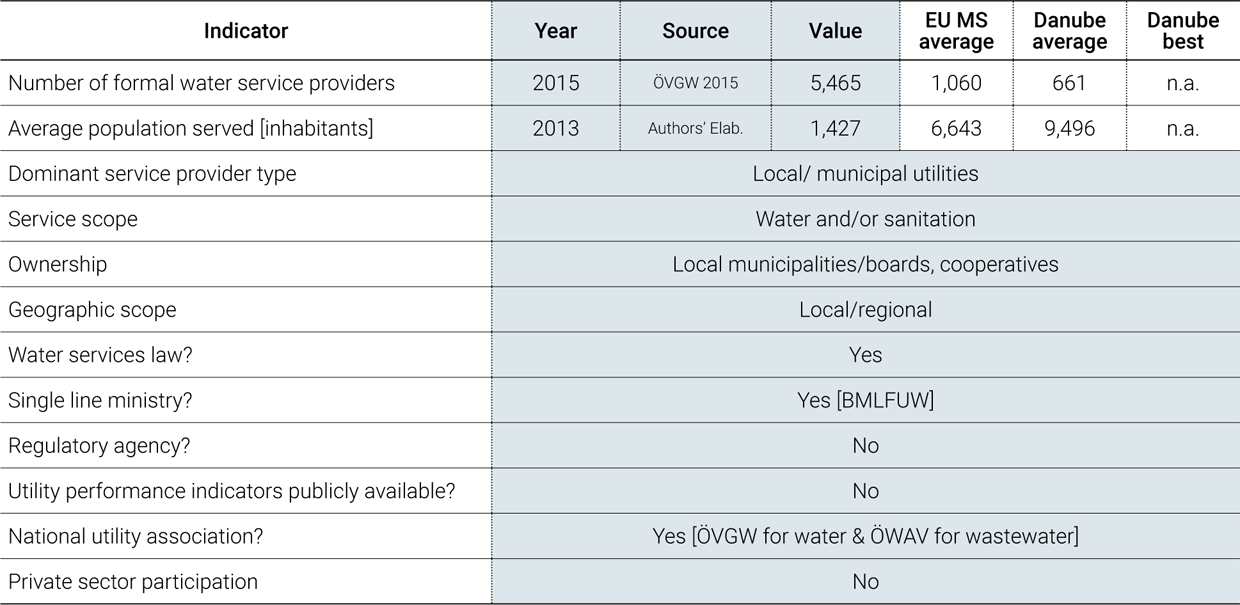
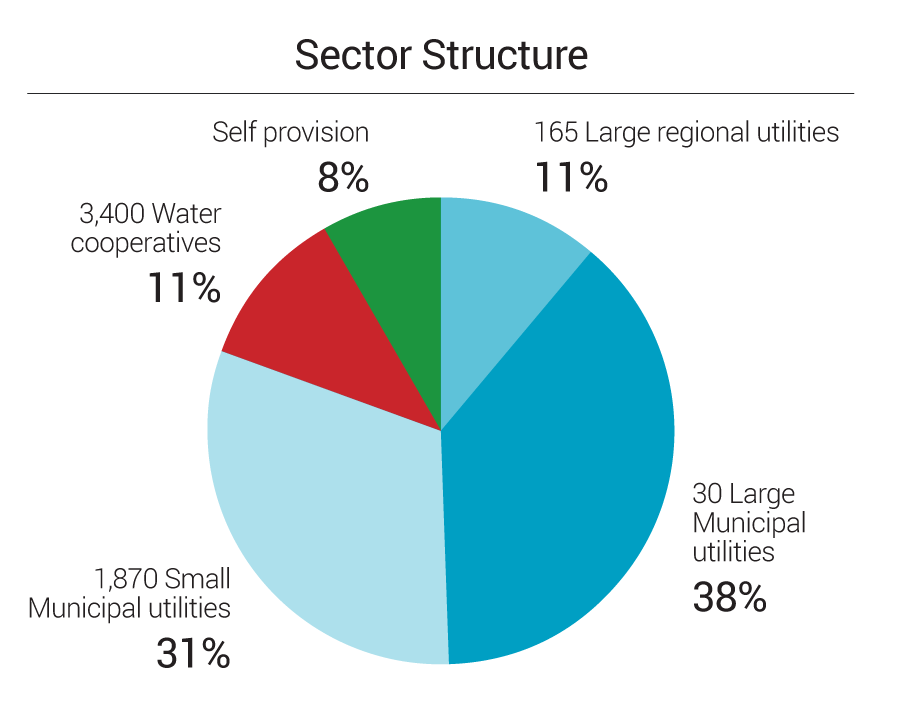
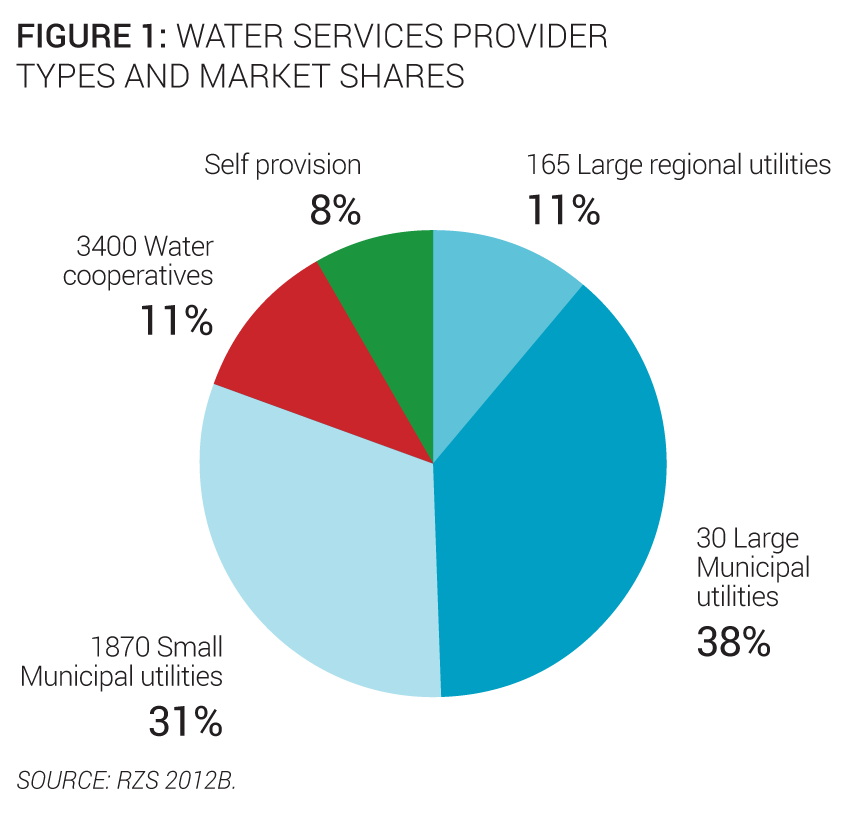 Service provision. Municipalities are the dominant service providers. Indeed, large and small municipal utilities serve nearly 70% of the population. Regional utilities and water supply cooperatives each provide water to 11% of inhabitants, and the remaining 8% rely on piped self-provision (Figure 1). Twenty-four percent of Austrians are served by water utilities supplying less than 5,000 inhabitants, and 66% are connected to water utilities supplying more than 5,000 inhabitants (ÖVGW 2015). With an average population of 1,427 inhabitants per utility, the water sector is characterized by very small size in regional comparison (Authors’ elaboration.).
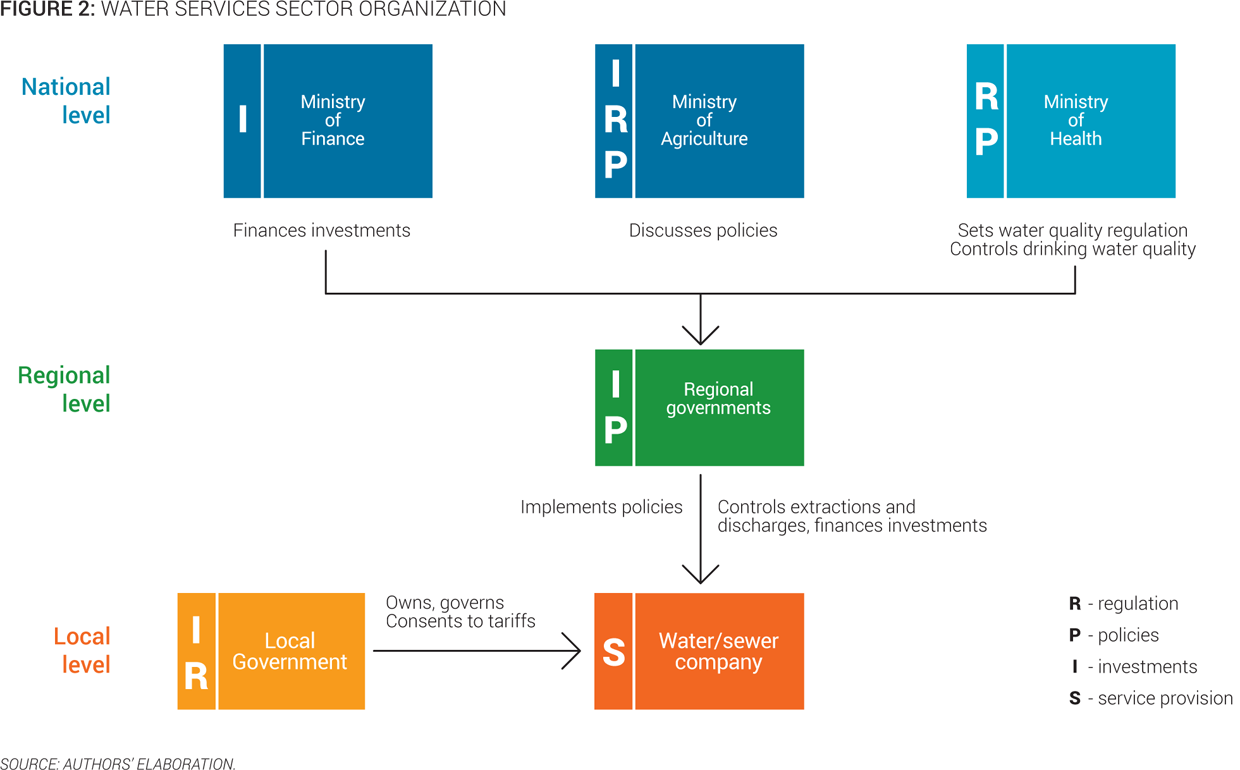
Policy making and sector institutions. The sector is regulated at the national and regional levels. There is a clear distinction between responsibilities borne by each level, and no overlap among the following stakeholders (Figure 2):
- The Ministry of Agriculture, Forestry, Environment and Water Management, which is the line ministry responsible for the definition of environmental policy, including technical and subsidizing regulations for water supply and sanitation (BMLFUW 2015).
- The Ministry of Finance, which is responsible for subsidising the water sector via the Kommunalkredit Austria AG (BMF 2015).
- The Ministry of Health, which is responsible for setting tap water quality standards and for monitoring drinking water quality compliance (BMG 2015b).
- The nine state governments, which are in charge of implementing and enforcing national regulations via their administrative districts (Parlament 2015).
Upper Austria Water
Founded in 1946, Upper Austria Water is a rural association of more than 1,700 cooperatives in the Federal State of Upper Austria. It is in charge of decentralized, small-scale water supply and sewerage installations, and flood protection and irrigation. It provides support to members on technical, legal, financial, and organizational issues. It also provides operations and maintenance services and proposes education and training sessions, as well as networking activities and information exchange opportunities.
Capacity and training. Key staff qualifications are legally regulated, and the Austrian water associations ÖVGW and ÖWAV are key providers of education and training in the sector. Austrian legislation requires that staff operating water facilities have adequate qualifications; the water stakeholders have agreed on a uniform training scheme, which is implemented in every region by the waterworks associations. The water supply and sanitation staff is highly qualified and staff turnover generally low. In the rural context, local water associations and cooperatives provide support on technical, legal, financial, and organizational issues to its members. They also propose education and training sessions, as well as networking activities and information exchange opportunities.
Economic regulation. Tariffs are based on a revenue cap. Referring to the cost recovery principle, water utilities assess the cost for 1 m³ and set a new water tariff accordingly under the approval of local municipal governments. According to law, the tariff can be up to twice the annual financial requirement of the water utility. Any additional demand to raise tariffs must be made with regard to a specific context affecting the water service. Many water utilities also link their tariff to the annual inflation rate.
Kommunalkredit
The Austrian environmental support scheme has been managed since 1993 by Kommunalkredit Public Consulting (KPC), a specialist in environmental fund management and development, which mainly acts on behalf of the Austrian Ministry of Agriculture, Forestry, Environment and Water Management. KPC has appraised more than 40,000 project applications for the water sector, representing investments of nearly €17 billion and more than €4.8 billion in grants.
Ongoing or planned reforms. There is currently no ongoing reform in the water and sanitation sector in Austria. However, issues that will need to be addressed have been identified in strategic planning documents, such as the National Water Management Plan 2009. Issues include water resource protection from micropollutants, rehabilitation of existing infrastructure (planning strategy for 2013-2021), and climate change adaptation targeted at karst areas and flood risk management.
Access to Services

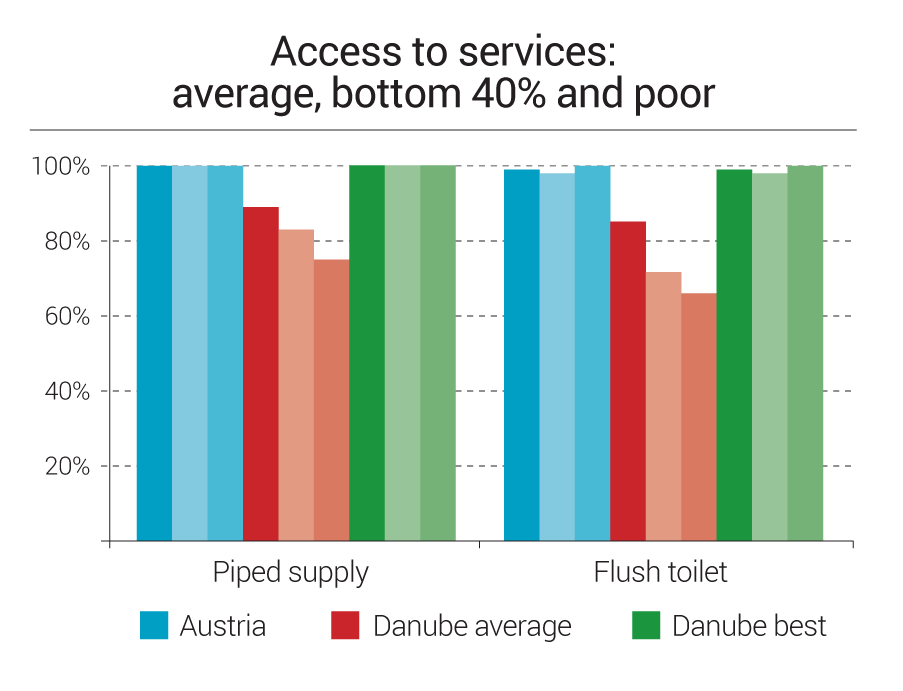
Service coverage. The Austrian population has full access to drinking water and sanitation services. Access to piped water is universal; 90% of the population is connected to a public water supply, and 10% rely on self-provision from their own wells and springs (Figure 3). Ninety-nine percent of the population has access to a flush toilet, and 94% have connections to public sewers (Figure 3). Up to 95% of the population is connected to a centralized wastewater treatment plant, and 100% of the wastewater volume collected is treated. (Authors’ elaboration)
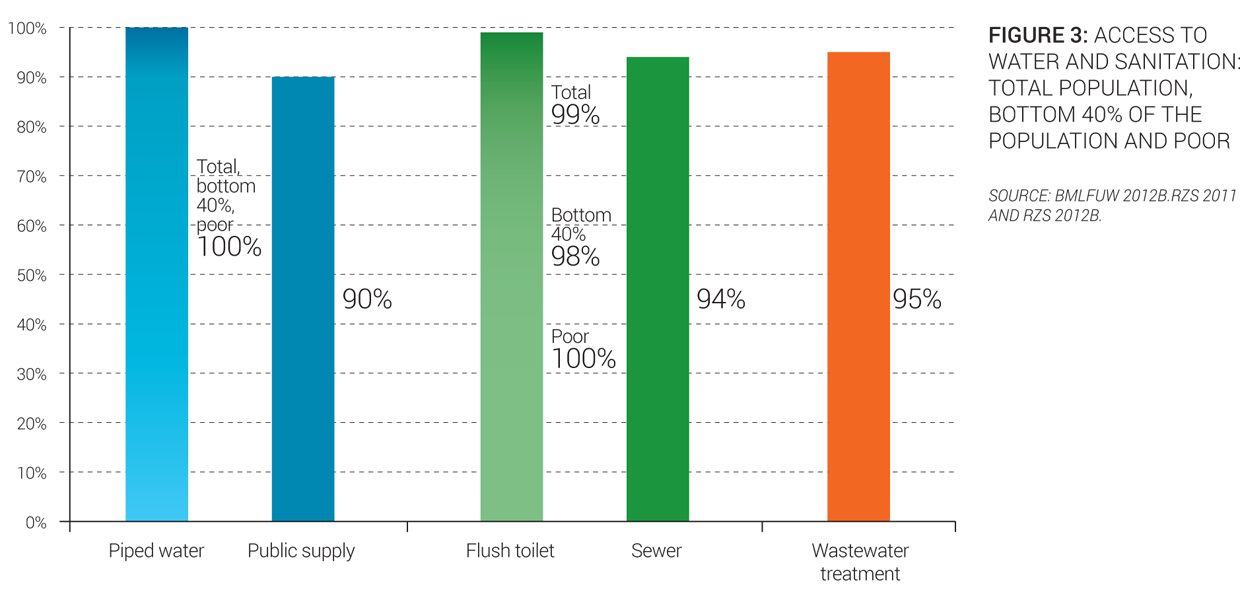
Equity of access to services. Poor households and minorities have full access to water and sanitation. One hundred percent of the Austrian population, including the lowest 40% and the poorest share of the population (those living on $2.50/day PPP), have access to piped water. Ninety-eight percent of the lowest 40% of the population and 100% of the poorest population have access to flush toilets. According to official Austrian statistics, minorities represent less than 1% of the total population. They are well integrated and not marginalized in terms of access to water supply and sanitation.
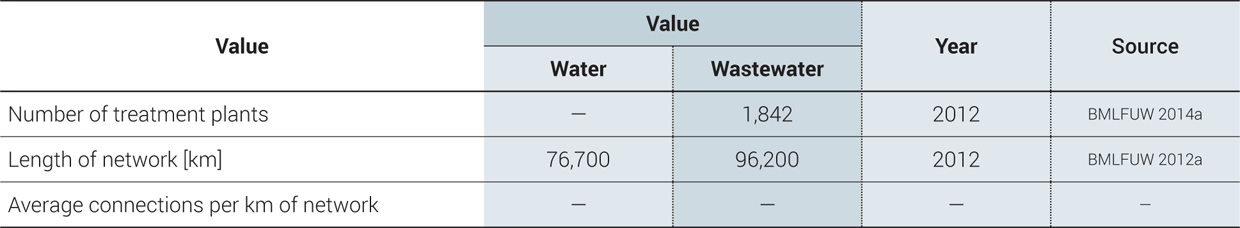
Service infrastructure. Austria’s water sector infrastructure has benefited from significant amounts of investments. Around 76,700 km of water pipes supply more than 90% of the Austrian population (Figure 3). There are 1.4 million connections and about 2,600 tapped springs. The Austrian population is mainly supplied with non-treated drinking water (93%). In the wastewater sector, there are around 96,200 km of sewage pipes and 1,842 treatment plants (BMLFUW 2014a). In recent decades, significant amounts of money have been invested in the water supply and wastewater infrastructure. The current and future priority is to implement a long-term asset management policy.
Performance of Services
Service Quality

Quality of service. The quality of water utilities in Austria is high, as is the quality of drinking water. Drinking water quality compliance is 99.8% for microbiological and 100% for chemical parameters (BMG 2015a). Water is provided 24/7. Due to higher efficiency levels of household machines and changes in consumer behavior, average water consumption per capita has been decreasing for the last six years, from 147 liters per day to 140 liters per day (Expert estimate). According to the “Austrian Drinking Water Report” (BMG 2015a), in 2010 a relatively high number of utilities serving less than 5,000 inhabitants asked for 118 exceptional derogations due to high values of nitrate or pesticides. The same year, utilities serving more than 5,000 inhabitants asked for 5 exceptional derogations. Around 28,000 inhabitants were affected by these exceptional permissions, 22,000 of whom were served by 3 several utilities (BMG 2015a).
Customer satisfaction. The Austrian population is highly satisfied with the quality of service. According to a Gallup international survey, 95% of the population is highly satisfied with drinking water quality and service quality (Gallup 2013), a rate among the highest recorded in the survey. Eighty-six percent of Austrians think the price of water is acceptable or even low (AQA & ÖVGW 2014).

Efficiency of Services

Overall efficiency. Austrian water utilities are generally efficient. In all data surveys performed over the decades, more meters than connections were recorded, indicating that most utilities have a metering level of 100%. Additional meters are installed on transport pipes to monitor losses and zone input values. Only in rural areas do some single, very small water cooperatives (up to 10 connections) not use water meters. The nonrevenue water level is relatively low, at 16% and 7m3/km/day in 2012. Staff productivity corresponds to international best practices, with 2 employees per 1,000 connections. However, staff productivity varies significantly among rural and urban utilities, long-distance suppliers, and water cooperatives. Staff in many small Water cooperatives often works voluntarily (ÖVGW 2015).
Recent trends. The efficiency of utilities has been stable over time. From 2007 to 2012, the billing collection rate for a sample of utilities representing at least 50% of the population served was below 100%, showing some difficulties collecting billed volumes of water (Figure 4). However, in 2013, the collection rate was 105%, indicating a capacity to recover unpaid bills (ÖVGW 2015). Nonrevenue water remained stable during the same period.
Financing of Services
Sector Financing
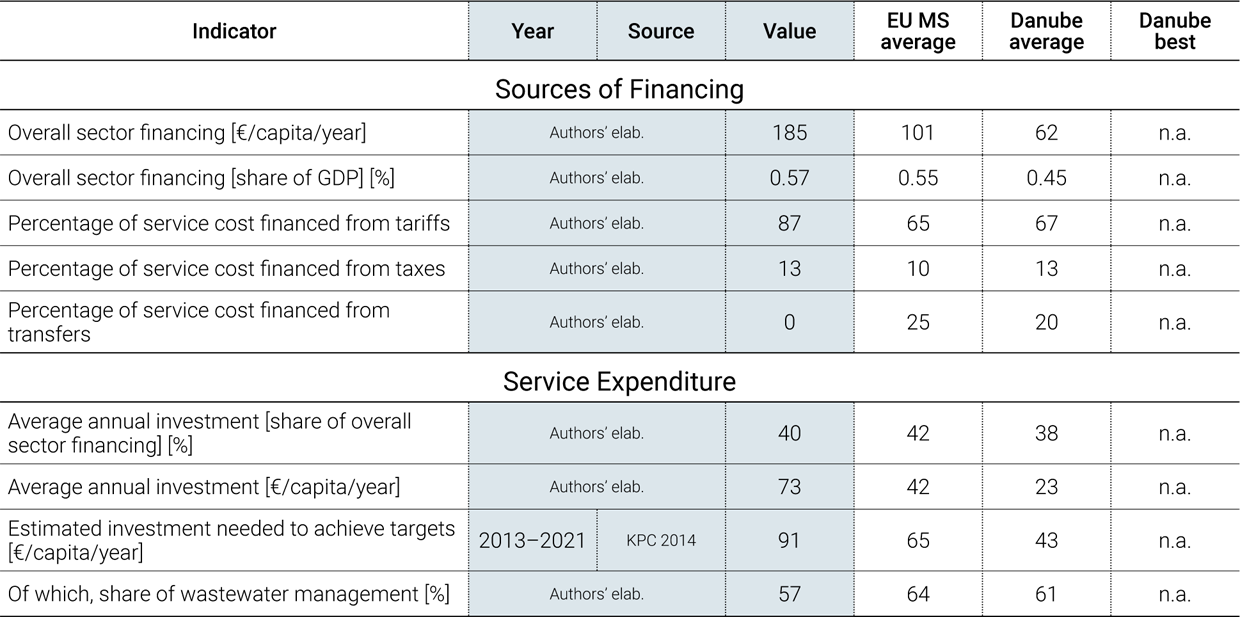
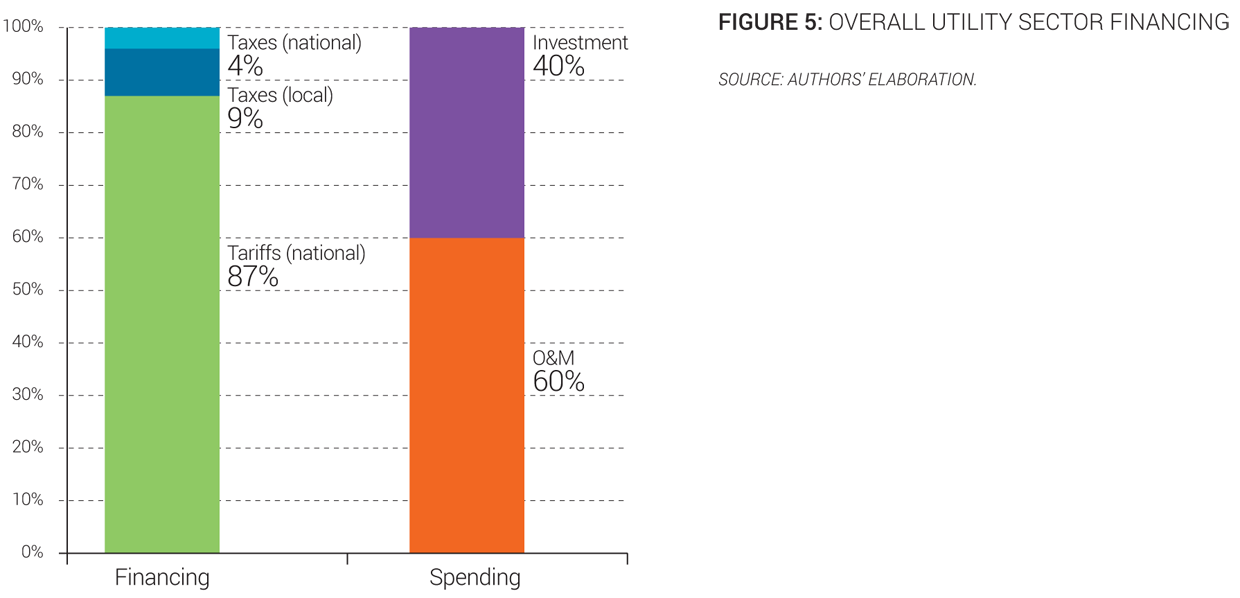
Overall sector financing. The sector is financed mainly by revenues from tariffs, which entirely cover operations and maintenance costs, as well as a significant share of investment costs. Some subsidies are granted by national local budgets to complement funding for investments, which represent 40% of sector spending (Figure 5).
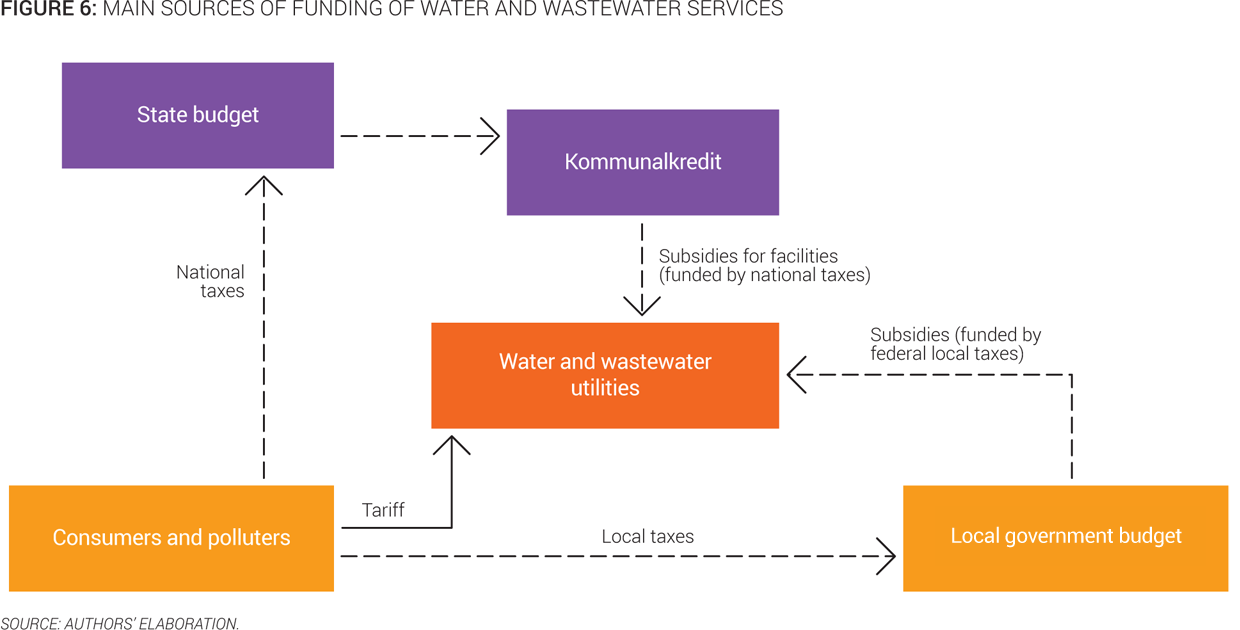
The main sources of funding of water and wastewater utilities are described in Figure 6, using the OECD three Ts methodology (tariffs, transfers, and taxes).
Investment needs. Financing necessary investments is a challenge for the water sector. Austria has developed a planning strategy for 2013-2021, to implement renovation and new investments for both water and sanitation infrastructure. This total plan amounts to €6.95 billion, with €2.96 billion dedicated to water and €3.99 billion to wastewater, representing an average annual per capita investment of €91 (KPC 2014).
Investments. Investment rates are high but declining. Utilities operate with a budget based on revenues from tariffs. For investments such as rehabilitation of pipes or rehabilitation of drinking water tanks, subsidies are granted from national and regional budgets. From 1993 to 2013, €13.29 billion was invested in the sanitation sector, and €3.1 billion was invested in the water supply sector (BMLFUW 2014b). See Figure 7 for a comparison of investment sources and uses. Overall, the annual investment rate per capita was €73 (Authors’ elaboration), not very far from the necessary level; however, recent trends indicate decreases in overall investment levels.

Cost Recovery and Affordability

Cost recovery. Revenues from tariffs represent 87% of sector funding (Authors’ elaboration). As a result, the subsidy level is low (5%) (Authors’ elaboration). Operating cost coverage (collected revenues over operating costs) reaches a high level at 1.44 (Authors’elaboration) based on KPC 2008 and Vienna MA 5 2014, and the water and wastewater tariff represents on average €3.25/m3 (Figure 8).
Figure 8: Evolution of average water and wastewater tariff
(absolute and share of expenditure in total income)
 |
|
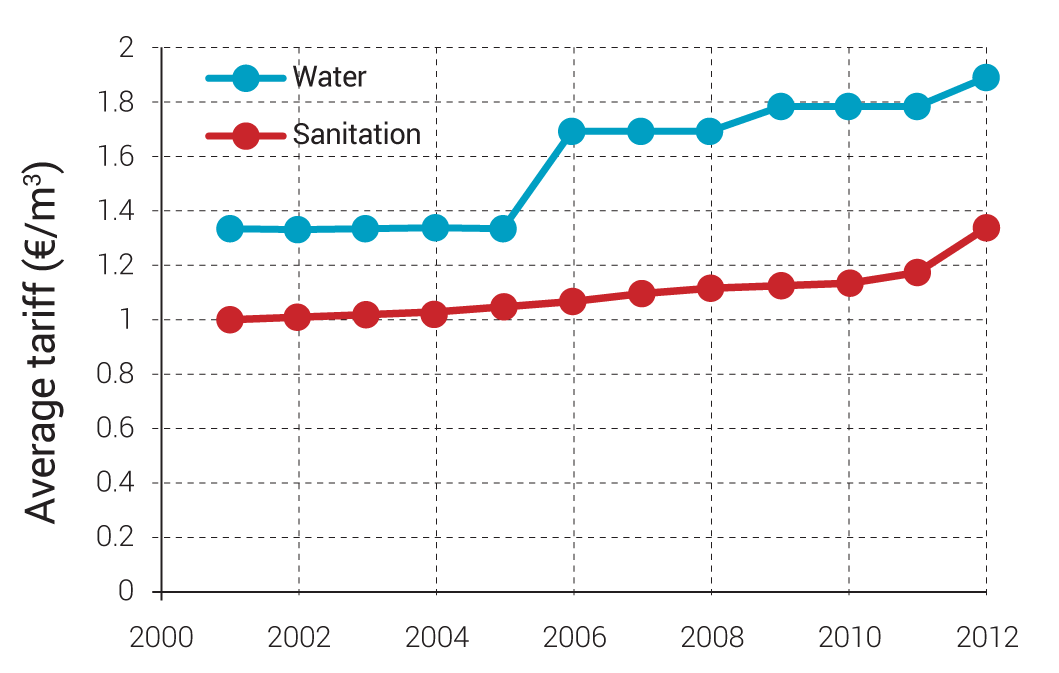
Tariffs. During the last 12 years, water and wastewater tariffs have increased by 28% (Expert estimate), while the annual average inflation rate was 2.1% (Statistics Austria 2015). With an average price at €3.25/m3, water represent 58% of the tariff and sanitation 42% (Expert estimate). But prices differ from one utility to another, and a large variability is observed.
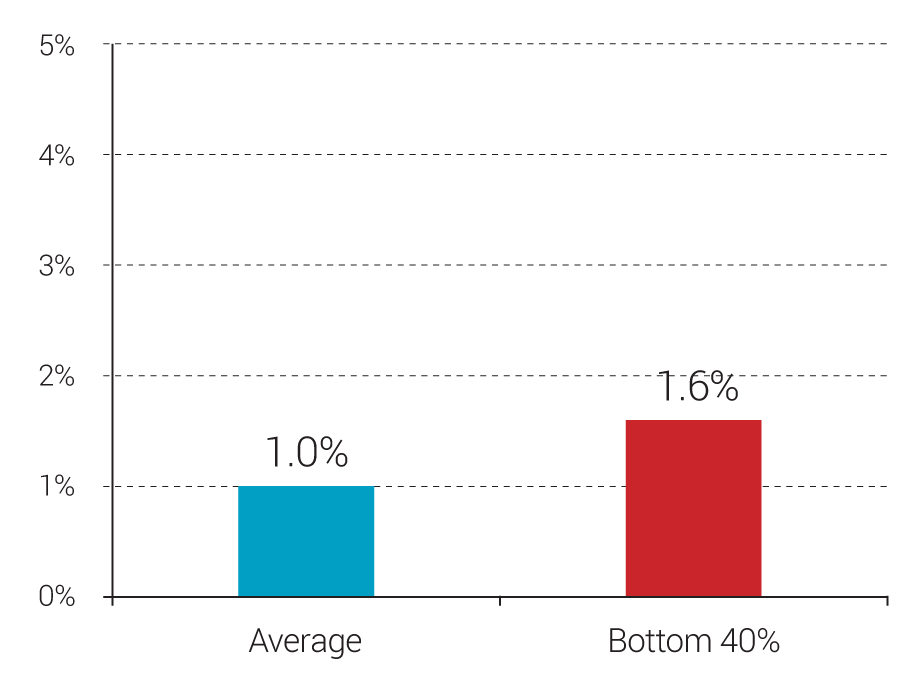
Affordability. In 2012, water and sanitation services remained affordable at only 1.0% of average household income. For the bottom 40% of the population, a potential water and sanitation invoice amounts to 1.6% of the household income. As a result, tariffs are generally considered affordable (Figure 8).
Water Sector Sustainability and Main Challenges
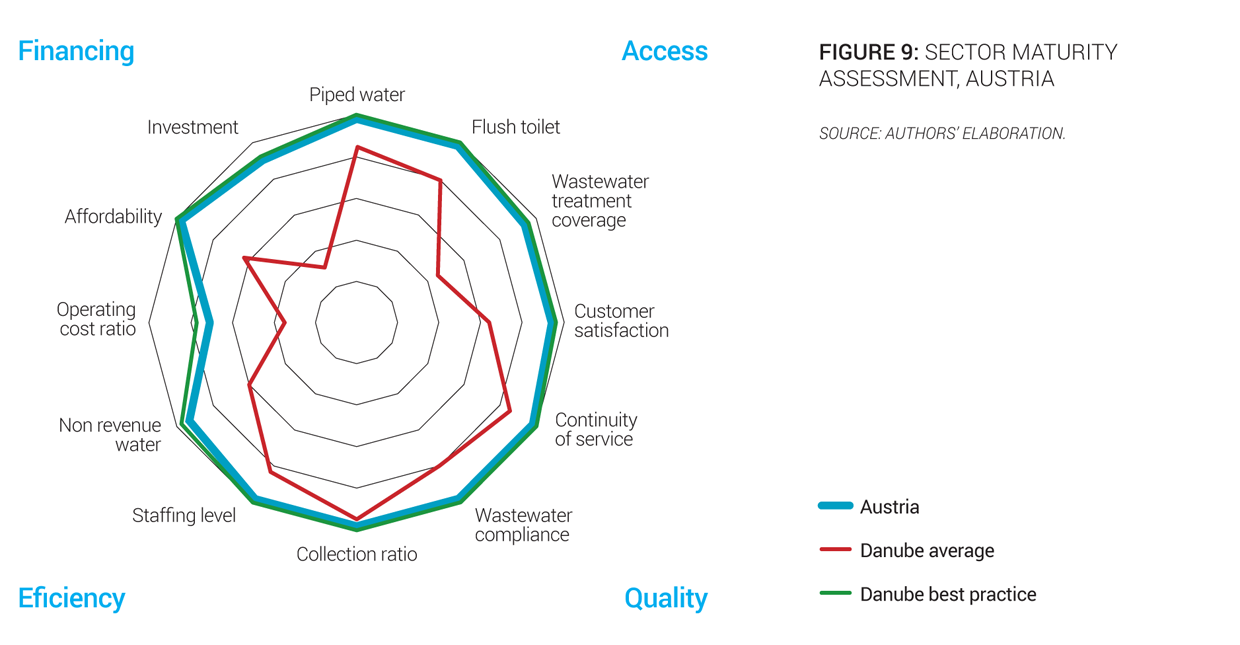
To evaluate and reflect the sustainability of services in the region, an overall sector maturity assessment was done taking into account four main dimensions: access to services, quality of services, efficiency of services, and financing of services. Each of these dimensions is measured through three simple and objective indicators. For each indicator, best practice values are established by looking at the best performers in the region, and countries closest to those best performers are deemed to have a more mature sector. A more complete description of the methodology to assess the sector maturity is included in the Annex of the State of the Sector Regional Report from the Danube Water Program. The outcomes of this assessment for the Austrian water sector are presented in Figure 9, which also shows average and best practices in the Danube region. The Austrian sector maturity score is 96, which is significantly higher than the Danube average maturity of 64, and the highest score in the region. The assessment shows that, on average, the country performs very well in terms of access to piped water and flush toilet, wastewater treatment coverage, customer satisfaction, continuity of service, wastewater compliance, collection ratio, and nonrevenue water (Figure 9).
The main sector challenges are:
-
Reducing pollution of water resources used for drinking purposes. Groundwater resources, which are the drinking water resources, face elevated levels of nitrate and pesticides in some regions. The protection of resources against pollution due to the agriculture sector and the industry is an ongoing challenge, since high levels of nitrate and pesticides have been recorded in some regions of the country.
-
Adapting to climate change. Adaption of the sewer systems to manage heavier rainfalls due to climate change will be an important challenge in the near future. In addition questions of energy recovery and sludge treatment are currently being discussed.
-
Improving asset management. During the last decades huge amounts of money have been invested into the water supply and wastewater sectors. It is important to maintain these assets to stay on a stable good practice level of service. Rehabilitation of existing infrastructure has been identified as a priority, and a strategy has been planned for 2013-2021 with a total investment plan of €6.55 billion (2.8 billion for water and 3.75 billion for wastewater).
Sources
-
AQA & ÖVGW. 2014. Water Report. Vienna: AQA GmbH & Austrian Association for Gas and Water.
-
BKA. 2015. Austrian Federal Chancellery. Accessed 2015. https://www.bka.gv.at.
-
BMF. 2015. Austrian Federal Ministry of Finance. Accessed 2015. https://www.bmf.gv.at.
-
BMG. 2015a. Austrian Drinking Water Report 2011-2013. Vienna: Austrian Federal Ministry of Health.
-
—. 2015b. Austrian Federal Ministry of Health. Accessed 2015. http://www.bmg.gv.at.
-
BMLFUW. 2012a. Technical Challenges in Sanitary Engineering. Vienna: Austrian Federal Ministry of Agriculture, Forestry, Environment and Water Management.
-
—. 2012b. Water Consumption and Water Demand - Evaluation of Empirical Data on Water Consumption. Vienna: Austrian Federal Ministry of Agriculture, Forestry, Environment and Water Management.
-
—. 2014a. Austrian 91/271/EEC Urban Waste Water Treatment Report 2014. Vienna: Austrian Federal Ministry of Agriculture, Forestry, Environment and Water Management.
-
—. 2014b. Federal Environmental Subsidies 2013. Vienna: Austrian Federal Ministry of Agriculture, Forestry, Environment and Water Management.
-
—. 2015. Austrian Federal Ministry of Agriculture, Forestry, Environment and Water Management. Accessed 2015. http://www.bmlfuw.gv.at/.
-
FAO Aquastat. 2015. Food and Agriculture Organization of the United Nations - AQUASTAT Database. Accessed 2015. http://www.fao.org/nr/water/aquastat/data/query/index.html?lang=en.
-
Gallup. 2013. World Poll. Accessed 2015. http://www.gallup.com/services/170945/world-poll.aspx.
-
ICPDR. 2015. International Commission for the Protection of the Danube River. Accessed 2015. http://www.icpdr.org.
-
KPC. 2008. Financing in the field of communal water supply and sewage disposal services in Austria. Vienna: Kommunalkredit Public Consulting GmbH.
-
—. 2014. Kommunalkredit Public Consulting GmbH: Results of the Evaluation of Investment Costs in Sanitary Engineering 2012. Accessed 2015. http://www.bmlfuw.gv.at/wasser/wasser-oesterreich/foerderungen/trinkwasser_abwasser/aktuelle_projekte/investitionskosten.html.
-
ÖVGW. 2015. Austrian Association for Gas and Water. Accessed 2015. http://www.ovgw.at.
-
Parlament. 2015. Parliament of the Republic of Austria: The Federal State of Austria. Accessed 2015. http://www.parlament.gv.at/ENGL/PERK/BOE/index.shtml.
-
Statistics Austria. 2015. Accessed 2015. http://www.statistik.at/web_en.
-
Vienna MA 5. 2014. Balance of Accounts of the Federal Capital of Vienna for the Year 2013. Vienna: Vienna City Administration: Municipal Department 5 - Financial Affairs.
-
World Bank. 2015. World Development Indicators. Accessed 2015. http://databank.worldbank.org/data/views/reports/tableview.aspx.