 Serbia
- Water Snapshot
- Context for Services
- Organization for Services
- Access to Services
- Performance of Services
- Financing of Services
- Water Sector Sustainability and Main Challenges
- Sources
WATER SNAPSHOT
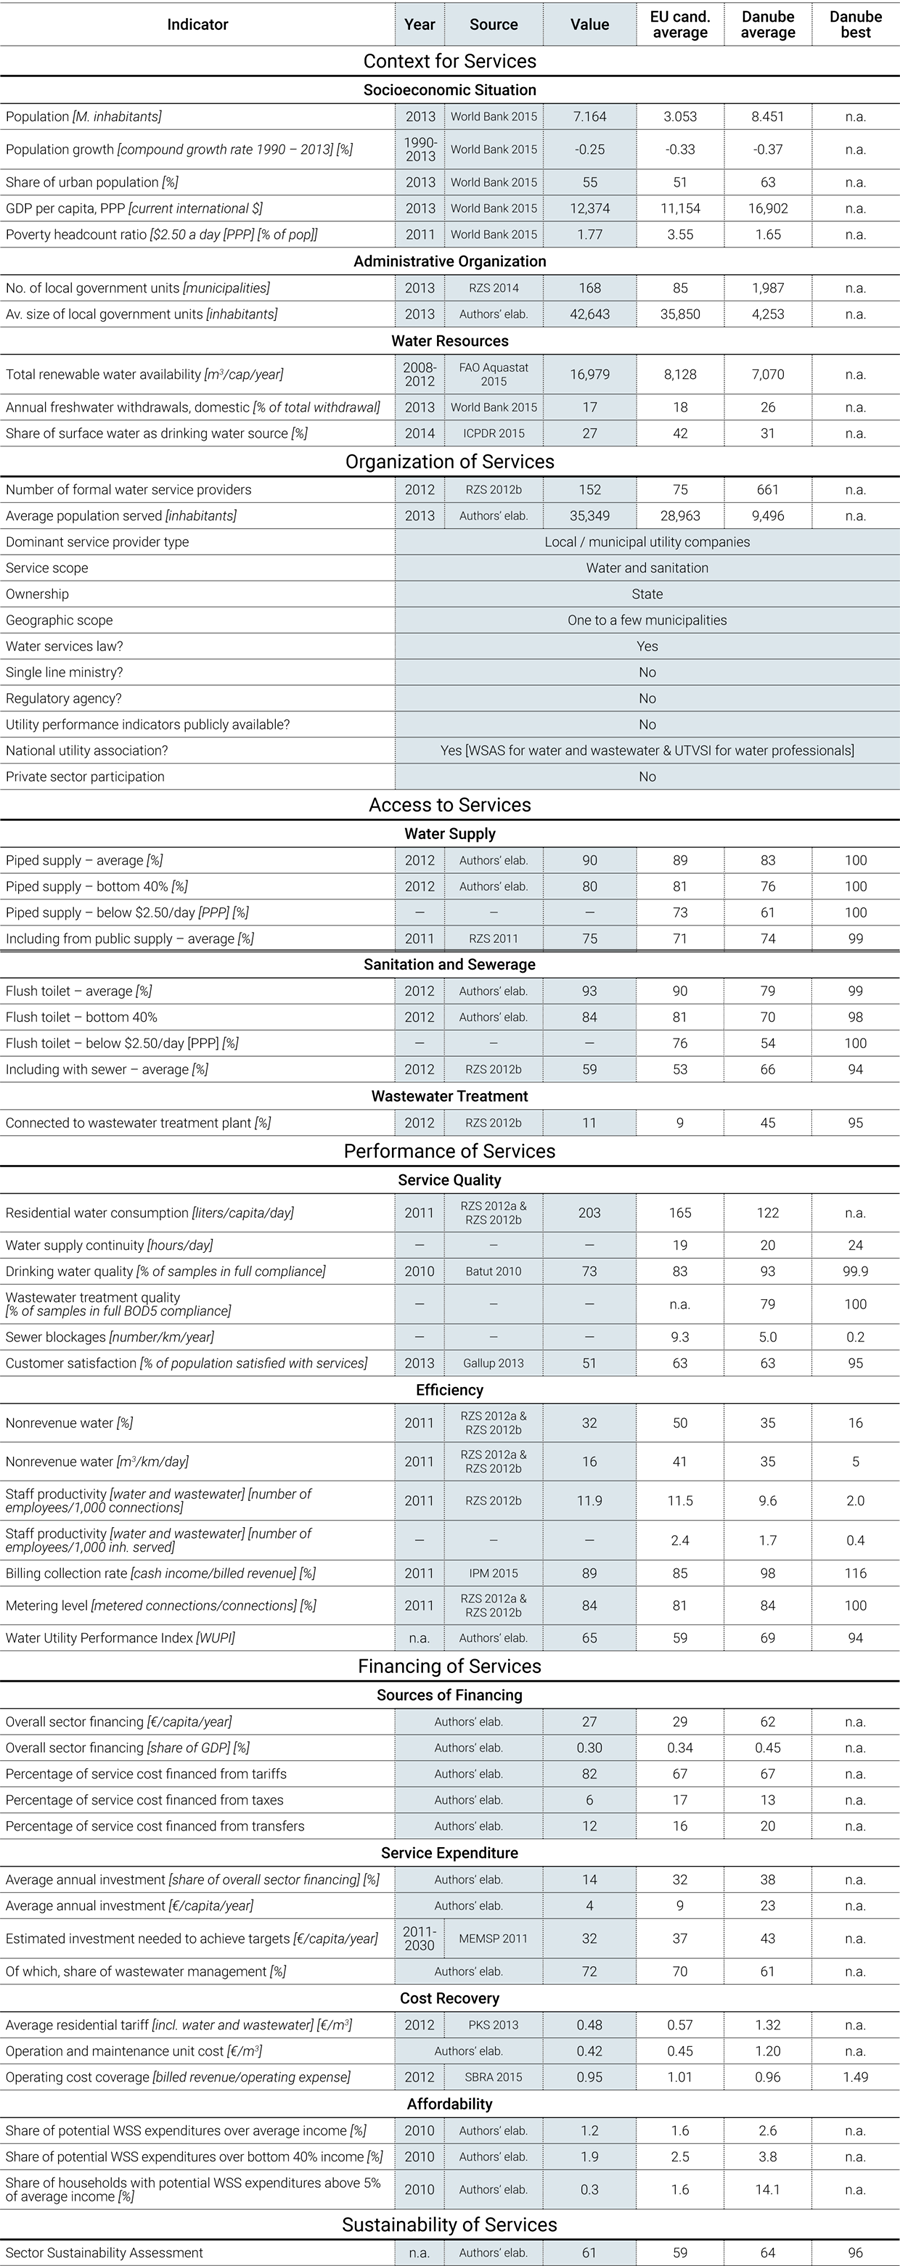
Sources for all numbers in the snapshot are provided in full in the body of this country page; a complete description of the methodology is provided in the State of the Sector Regional Report available under SoS.danubis.org/Report.
 |
 |
Key Water and Sanitation Sector Challenges
-
Strengthening and clarifying sector governance. To address overlapping mandates among ministries in charge of water sector policies and regulation, a clarification and definition of roles and duties is needed at the national level to improve water policy efficiency. Such a clarification will be particularly important to ensure an effective EU negotiation and accession process and a successful and sustainable infrastructure build-up.
-
Ensuring tariff setting according to the cost recovery principle to improve overall performance in preparation for EU accession. Due to the inflation cap imposed by the Ministry of Finance since 2004, water tariffs in Serbia are kept very low, which prevents utilities from recovering production costs, not to mention capital expenditure. As a result, some utilities have significant losses, assets are not being properly managed and replaced; and conditions are not in place for the significant infrastructure development necessary to comply with the EU environmental acquis.
-
Enhancing water utility staff capacity and training. In addition to financing challenges, education and training of staff at all levels of water utilities are key to ensure long-lasting operational efficiency and sustainability of the water sector.
Further resources
On water services in the Danube Region
- A regional report analyzing the State of Sector in the region, as well as detailed country notes for15 additional countries, are available under SoS.danubis.org
- Detailed utility performance data is accessible, if available, under www.danubis.org/database
On water services in Serbia
The following documents are recommended for further reading; the documents, and more, are available at www.danubis.org/eng/country-resources/serbia
-
MEMSP. 2011. National Environmental Approximation Strategy for the Republic of Serbia. Belgrade: Ministry of Environment, Mining and Spatial Planning of the Republic of Serbia.
-
MISP. 2011. Draft Strategy for Restructuring Public Utility Companies in the Republic of Serbia. Belgrade: Municipal Infrastructure Support Programme.
-
UNDP. 2010. Water and human rights sector assessment, Serbia. New York City: United Nations Development Program - Regional Program.
-
World Bank. 2013. Serbia, Municipal Finance and Expenditure Review. Washington DC: World Bank.
Context for Services
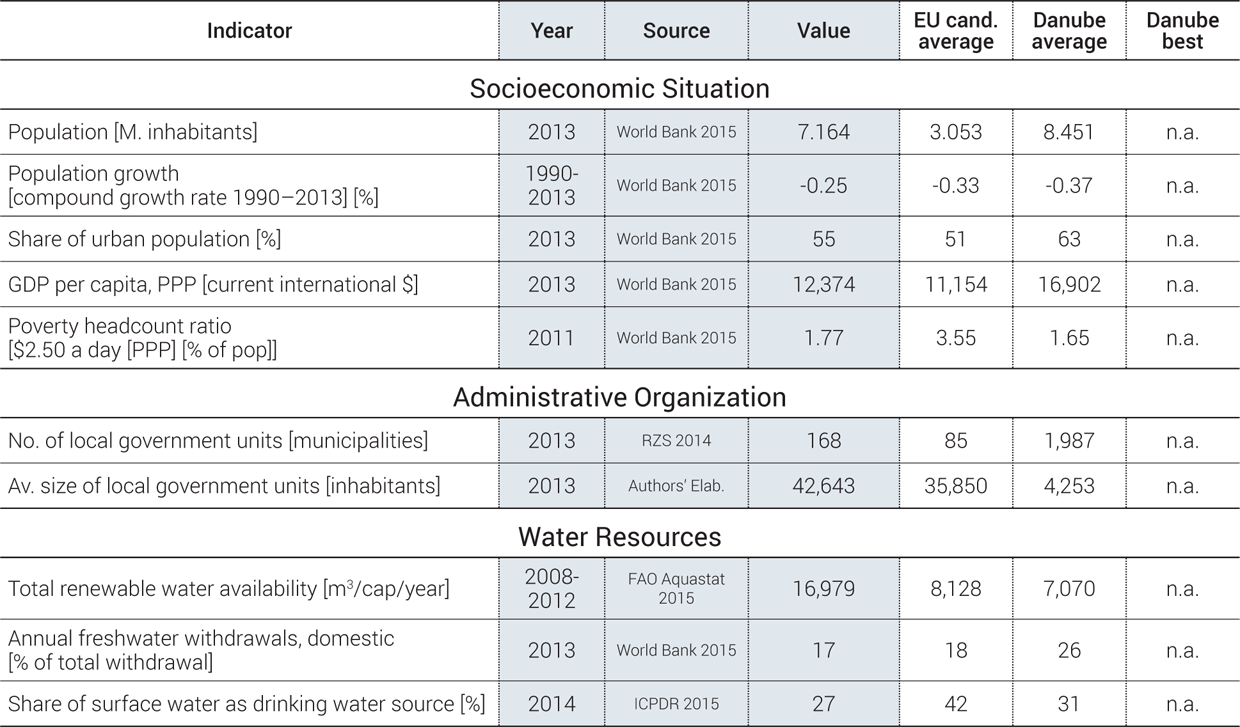
Economy. Serbia is an official EU membership candidate, but it faces a challenging economic situation and poverty issues. According to the World Bank Development Indicators, Serbia has 7.2 million inhabitants, among whom 55% live in urban areas. The country has a population density of 81.3 inhabitants/km2. With a per capita GDP of $12,374 current international PPP dollars, an unemployment rate of 22%, and 1.8% of the population living at the $2.50 a day poverty line, the economic situation of Serbia is challenging compared to neighboring countries. This is especially true in the poorest regions located in the eastern and southwestern parts of the country. From 2001 to 2008, Serbia’s annual average GDP growth was 5% (World Bank 2015), but due to repeated recessions, the pace of economic growth has recently slowed, while the public debt has increased. Vulnerable minorities constitute 6% of the Serbian population, and in 2009 a strategic plan for the improvement of the position of the Roma minority was adopted (MHMR 2010). In 2012, Serbia was granted official EU membership candidate status, and official EU accession negotiations were to have started in January 2014. To date, however, they have not.
Governance. Serbia has strong local governments. Serbia is a parliamentary republic composed of 4 regions, 1 autonomous province (Vojvodina), and 25 districts, including the city of Belgrade. There are 168 municipalities that form the basic level of self-government. According to the law on communal services, municipalities, cities, and the city of Belgrade have sole responsibility for establishing and organizing the provision of water and wastewater services.
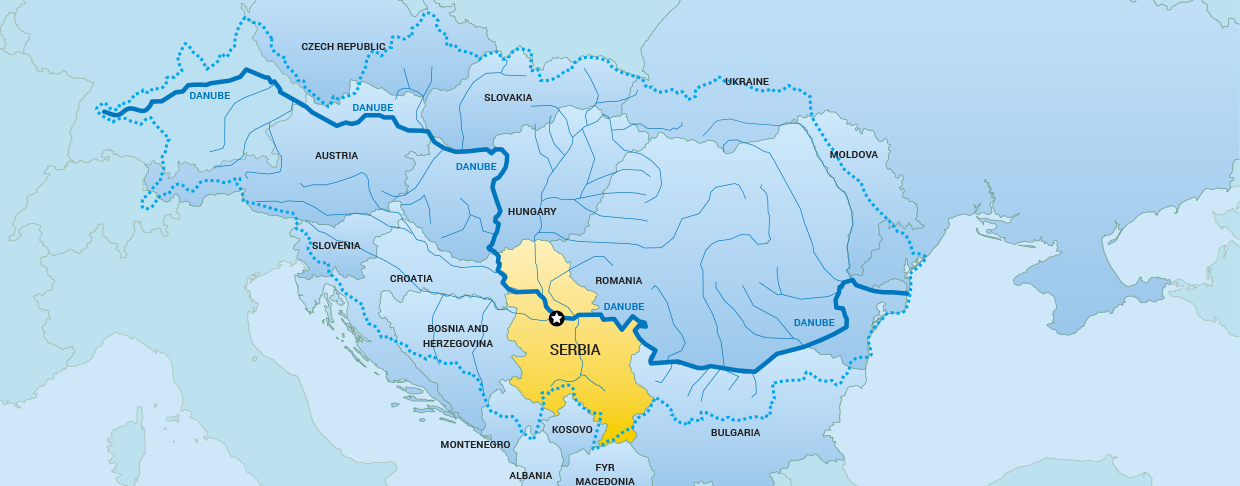
Water resources. Serbia is dependent on water resources that originate outside its territory. Among the annual average 162 billion m3 of available water in Serbia (FAO Aquastat 2015), 90% are transit waters flowing through the country via the Danube, Sava, and Tisa Rivers and other waterways. Thus, Serbia is largely dependent on water resources that originate outside its national territory. International cooperation and transboundary water management are therefore vital to the country. The Serbian territory is predominantly upland and lies almost entirely (92%) within the Danube basin, which has been classified as a “sensitive area” under the EU urban wastewater treatment directive. It can be divided into two distinct topographical regions. The northern region forms part of the Pannonian Plain, intersected by rivers, canals, and lakes. To the south of the Danube, the terrain is hilly and mountainous. The central southern region connects to the southern Balkans via the Morava and Vardar/Axios basins. Annual average rainfalls are lowest in the north (<500 mm) and highest in the southwest, where they can cause heavy flooding affecting water and wastewater services and resulting in damage to the infrastructure and serious drinking water shortages.
Water supply sources. Groundwater is mainly used for drinking water, and surface water for other water uses. Groundwater provides 73% of the raw water used for drinking water supply, whereas it represents only 12% of the overall water abstracted in Serbia. Its quality is considered good, although there is some chemical contamination due to the uncontrolled use of various pesticides. Surface water accounts for 27% of drinking water supply and 88% of all water uses. It is extracted from streams and accumulations, and its quality is at risk due to the presence of ammonia, nitrates, sulphides, iron, and mineral oils in the Tisa River basin; evaporable phenols and manganese in wells in the area of Bačka; and arsenic in the rest of Vojvodina. Almost no effective sanitary protection zones have been implemented at water intakes (for both surface and ground waters). The recent deceleration in the Serbian economy has resulted in a major reduction in pollution emissions. The nutrient load from municipal effluent is a significant source of hydraulic wastewater volume due to the fact that municipal wastewaters are mainly discharged untreated, and that current industrial output is low. Discharges of nitrogen and phosphorus also contribute to the Danube pollution (MESP 2010).
Organization for Services

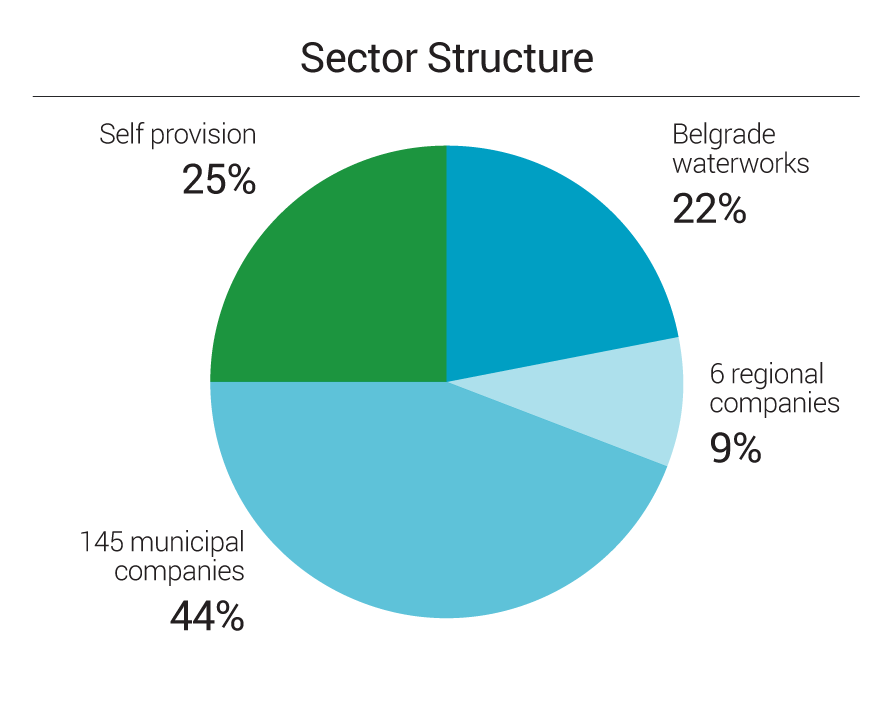
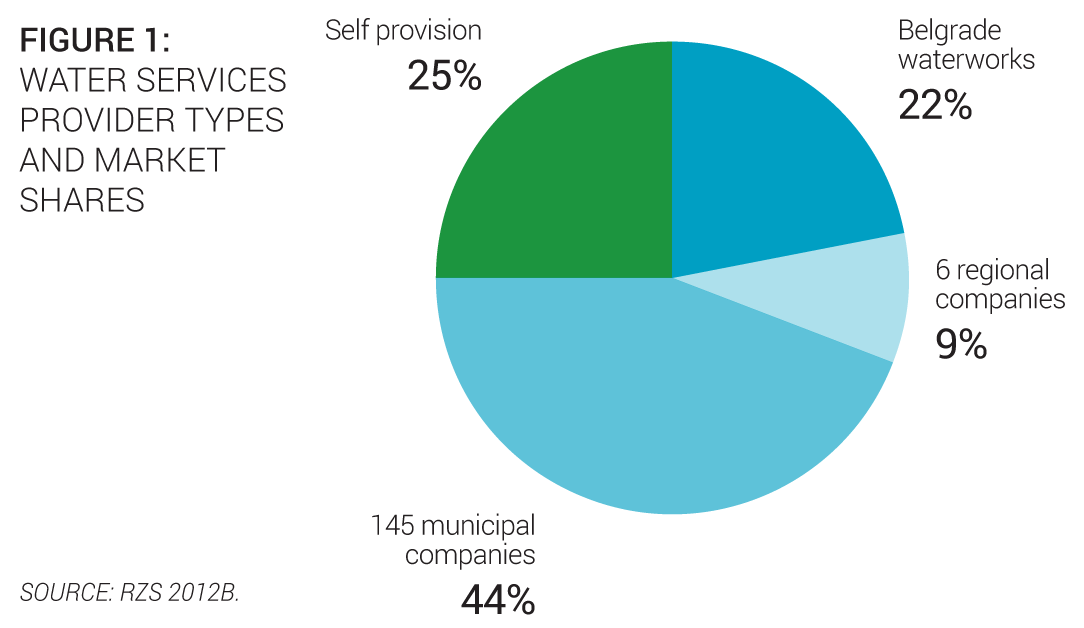 Service provision. Local governments are responsible for water and wastewater service provision through 152 public utility companies. These utility companies are founded by municipalities but remain state owned. The water sector is concentrated; 7 regional public utilities (including Belgrade waterworks) provide service to several large municipalities covering 31% of the population (Authors’ elaboration). One-hundred forty-five municipal public utilities serve 44% of the population (Figure 1). Overall, 150 utilities provide both water and sanitation services. In rural areas, inhabitants rely on self-provision (RZS 2012b).
Policy making and sector institutions. Several ministries regulate the water sector (Figure 2). Five main ministries constitute the national institutional framework of the water sector, with no clear line ministry and often overlapping mandates (NSRS 2014):
- The Ministry of Agriculture and Environmental Protection, with the Directorate of Water, which is in charge of water resources policy and integrated water management, and for issuing water abstraction licenses and discharge permits.
- The Ministry of Construction, Transport and Infrastructure, which is the parent ministry of water utility companies; it has no specific directorate in charge of water utilities, but does have a department for inspection supervision.
-
The Ministry of Public Administration and Local Self-government, within the Department for Local Self-government, supervises local self-governments, which manage water utility companies.
-
The Ministry of Finance, which is responsible for final control of tariff revision, which is proposed by water utility companies and accepted by local self-governments, in accordance with the general price policy.
-
The Ministry of Health and the local Institutes of Public Health, which monitor drinking water quality. Domestic drinking water standards are in compliance with the World Health Organization guidelines and the EU Drinking Water Directive. Quality controls are conducted in compliance with the Regulation on Hygienic Regularity of Quality of Drinking Water (OG FRY No. 42/1998).
-
The public water management companies of Waters of Serbia (Srbijavode), Waters of Vojvodina (Vode Vojvodine), and Waters of Belgrade (Beogradvode) are state-owned companies with responsibility for flood protection and for issuing opinions on legislation on water, and for maintenance of the water information system in their territory. They are under the umbrella of the Government of Serbia, the Government of Vojvodina, and the City of Belgrade, respectively, and from time to time they participate in maintenance and reconstruction of regional water facilities.

Capacity and training. Efforts have already been made to improve staff capacity and training, but much remains to be done. The State Water Directorate and the public water companies work on capacity building and on education and staff training through specialized projects. The three main water professional and utility associations in Serbia, the Waterworks and Sewerage Association of Serbia, the Association for Water Technology and Sanitary Engineering, and the Union of Engineers and Technicians of Serbia, also provide training, technical assistance, and knowledge exchange activities (workshops, conferences, journal) to water sector stakeholders. However, there is still an important need to increase this activity at the national level, especially since management staff turnover is high due to the political cycle and political appointments. The Belgrade utility employs around one-third of the total number of employees (PWMC 2015).
Economic regulation. Tariff setting in the water sector is mainly linked to targeted inflation. Tariffs are often revised yearly, and new prices are proposed in the utility business plans. They then must be approved by the municipal assembly. Since 2004, the Ministry of Finance has imposed a ceiling on tariff increases, and public utility companies cannot exceed the programmed inflation rate. Tariff setting has thus often been dominated by political and social considerations rather than public utility company operation, maintenance, and investment needs (UTVSI 2007).
Ongoing or planned reforms. A draft National Public Utility Strategy has never been implemented. Public utility companies are specific legal entities, operating either as a multisector operator or as a water-only operator. They are managed and supervised by municipalities, but asset ownership remains at the state level. The new 2006 Constitution of the Republic of Serbia transferred property rights to municipalities, but the property rights transfer is ongoing, and utility assets remain under state ownership. The national strategy and policy framework for the water sector in the Republic of Serbia appears to be comprehensive and adequate on paper. It focuses on the following areas: improvement of performance and efficiency of utilities, implementation of tariff reform measures included in the Water Law, and financing of capital investments. However, continued changes in the government structure have hampered reform initiatives, with the 2010 National Strategy on Local Public Utility Companies never moving beyond the conceptual stage. Extra efforts are needed to ensure all the elements contained in National Strategy are implemented (MISP 2011).
Access to Services

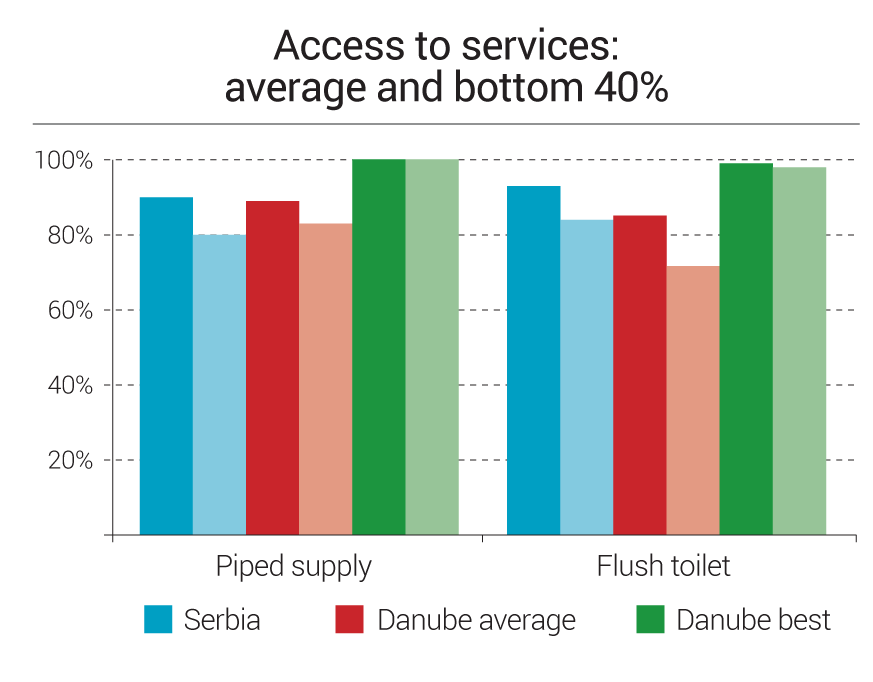
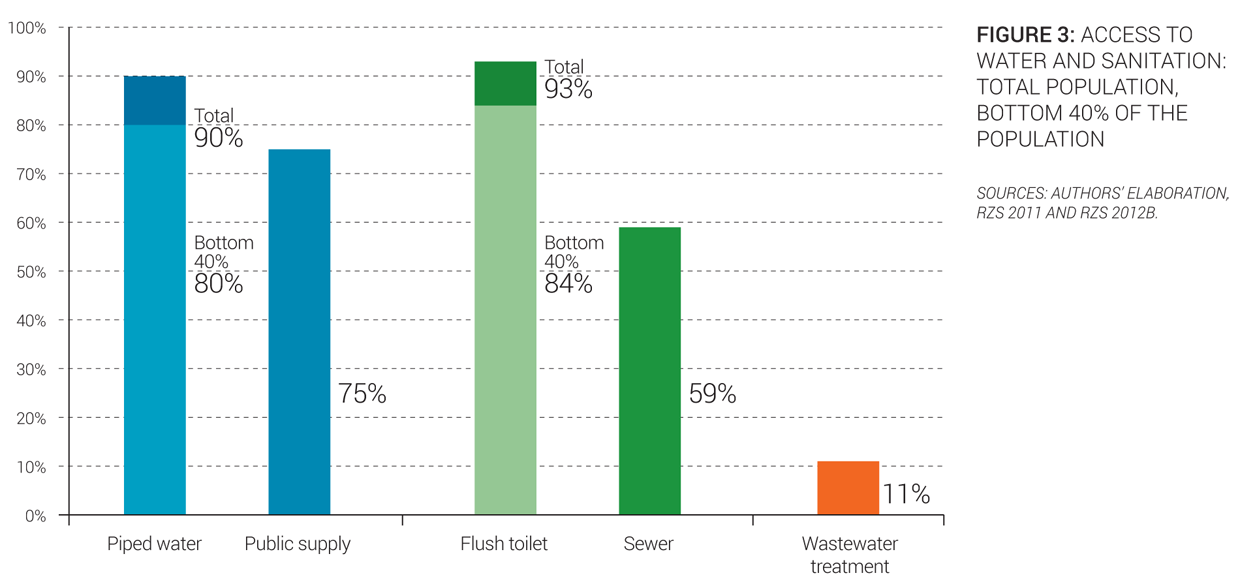
Service coverage. Serbia has good access to service. Serbia has good access to piped water (90%) and near-total access to flush toilets (93%). Access to publicly provided services is lower, at 75% for public water supply and 59% for sewerage (Figure 3). Only 11% of the population is connected to wastewater treatment. Effluents are treated mostly below Urban Wastewater Treatment Directive standards (MEMSP 2011), resulting in significant environmental and public health hazards. Most small communities (<2,000 people) do not have wastewater treatment plants and 18 of the 50 existing plants are not operational. To improve access to sanitation services, the Serbian National Environmental Strategy plans to upgrade the existing infrastructure, expand the sewage networks, and build primary and secondary wastewater treatment plants in 20 to 30 large agglomerations and hotspot locations. The plan also includes building sludge treatment facilities.
Equity of access to services. Twenty-two percent of Roma settlements do not have access to water. According to a UNDP 2011 survey, 22% of the Roma population do not have access to an improved water source (compared to 1% of the total population), and 39% do not have access to improved sanitation (compared to 5% of the total population) (UNDP Bratislava 2012). In 2009, a strategy for the improvement of the Roma’s position in Serbia was adopted. It is built around four priority areas for action: education, housing, employment, and health. Some results have been achieved in the areas of education and health, but no real improvement has been achieved in employment and housing (MHMR 2010).
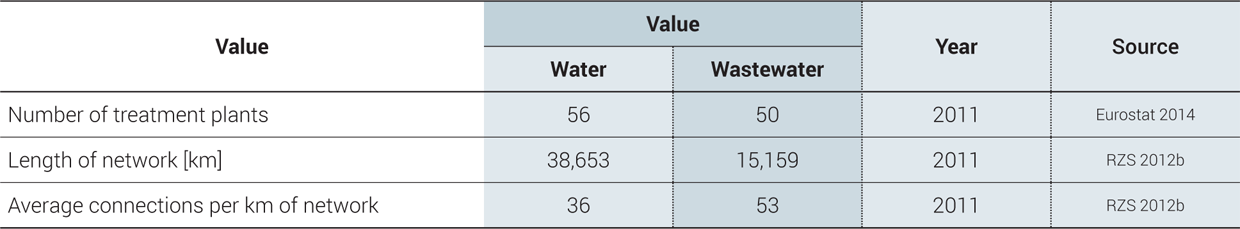
Service infrastructure. Water sector assets need renewal and upgrading. The water infrastructure in Serbia consists of 28 multipurpose dams and reservoirs storing more than 6,000 Mm3, 56 water treatment plants, and a 38,653 km network. Water supply systems and distribution networks generally need reconstruction and upgrading in capacity and/or technology. Wastewater assets comprise 50 treatment plants and a 15,159 km network. The capacity and technology of wastewater treatment plants and collectors also need to be renewed and upgraded. Thirty-two plants are operational, but few of them according to the designed criteria. Others work at lower efficiency than designed.
Serbia Data Availability
Data availability could be improved, since there is no consolidated set of data on water utilities in Serbia, as there is in some of the neighboring countries with regulatory agencies. Information is missing especially for water sector funding and spending. Some operational data are available for only a limited number of years, which prevents medium-term trend analysis. Some ad-hoc benchmarking efforts are being made through specific donor programs, however.
Performance of Services
Service Quality
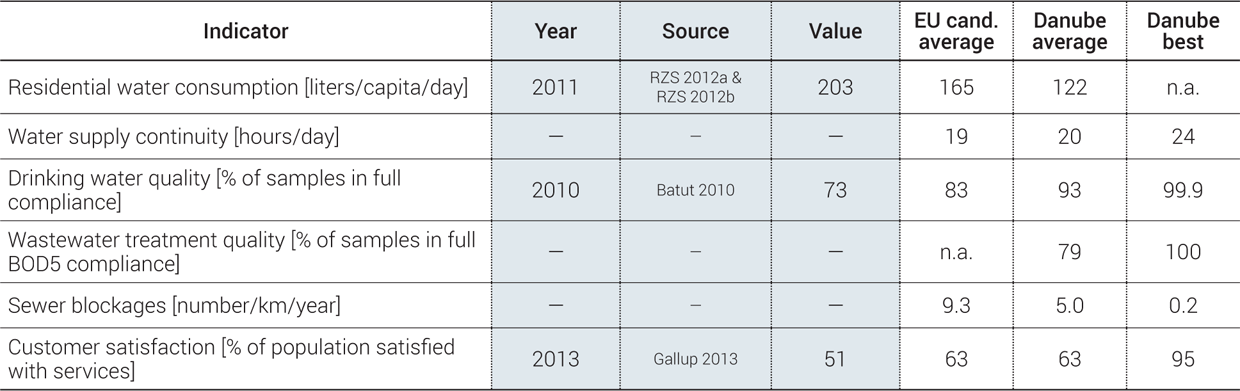
Quality of service. Serbia has good quality of service, but there are still some issues regarding drinking water quality. Water service continuity in most cities is nearly 24/7, but problems of surface water quality and treatment cause significant health risks (chronic or infectious diarrheal diseases). Those drinking water quality issues are due to poor infrastructure and contamination of surface water with pesticides and heavy metals, especially in rural areas, where there is almost no quality control. The low number and efficiency of municipal and industrial wastewater treatment facilities also result in significant organic and inorganic discharge.
Customer satisfaction. The satisfaction of the population with the service provided in their city is low, at 51% (Gallup 2013). This number is lower than in most countries in the region.
Efficiency of Services

Overall efficiency. Some important efficiency gains are still to be made. Few significant efforts have been made to transform public water utilities into more efficient organizations that work according to sound economic principles. Utilities are burdened with aging infrastructure, leading to energy and water losses that increase operational costs and decrease net income. The staffing level has been high and constant since 2008 despite the wage bill control from the Ministry of Economy, and it remains very high at 11.9 employees per 1,000 connections, compared to regional and international best practices (1 to 2 staff per 1,000 connections). The limited productivity is largely a consequence of the direct control exerted by local government authorities over utility staffing and management. The billing collection ratio is below regional best practices and should be improved to ensure increasing revenues.
Recent trends. The water sector shows mixed efficiency results and trends. The indicators mentioned above have followed different paths of evolution over the last 10 years. Overstaffing has decreased by 6% but remains high, nonrevenue water has increased by 13% (Figure 4), and the collection ratio has decreased by about 2%. As a result, no real efficiency gains have been made and no clear improvement of water and wastewater services efficiency has been achieved.

Financing of Services
Sector Financing

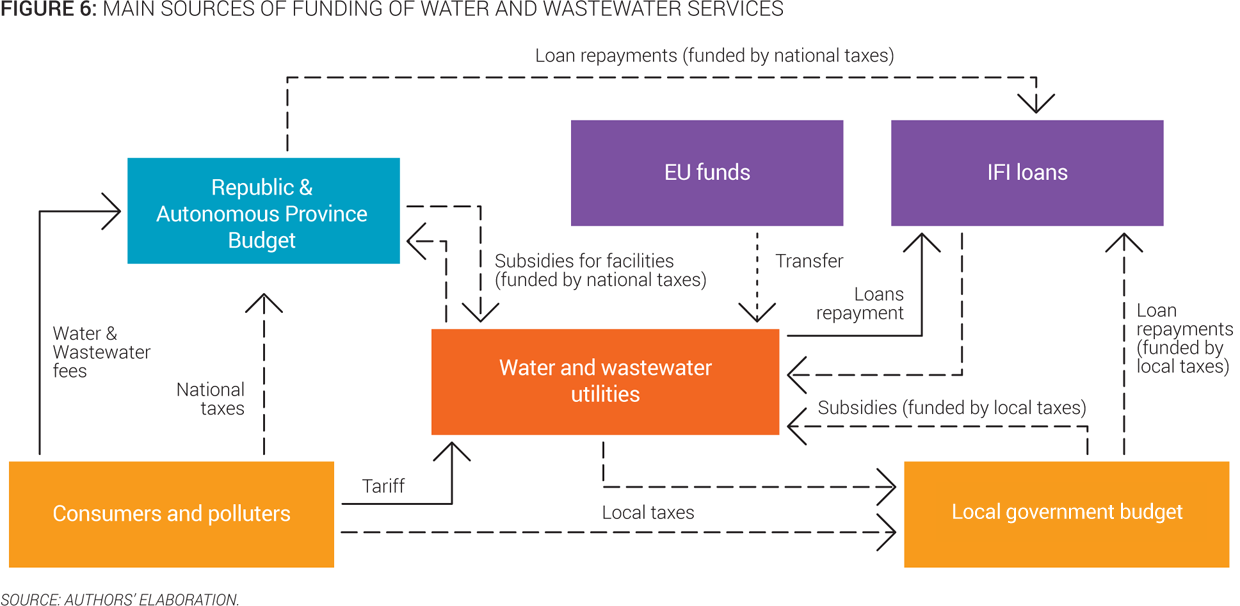
Overall sector financing. Tariffs barely cover operation and maintenance costs, which represent 86% of overall expenditure in the water sector. As a result, subsidies from the national budget are necessary to cover operation costs of utilities as well as investments, which are also funded by international grants. Investments represent less than 15% of sector costs, which are too low to fund the investments needed to maintain and expand both water and sanitation services (Figure 5).
Investment needs. Twice as much investment as is currently available is required to achieve EU compliance. Five billion euros in overall investment is needed to achieve full EU compliance—40% for drinking water supply and 60% for sanitation—or an average of €32/inhabitant/year for the next 20 years, about twice as much as the current annual investment rate.
Investments. The rate of investment is increasing but remains insufficient. The current investment level in Serbia is very low, at 4€/inhabitant/year in 2012, or 0.04% of nominal GDP. OECD-recommended levels for water sector investment range from to 1.2% to 6% for low-income countries (Figure 7). However, this level has tripled since 2007. A small share of water and wastewater investments is funded by subsidies from the central state budget (or Autonomous Province budget, which is part of the state budget). Subsidies are granted using a needs-based methodology formulated by the Water Directorate and according to the priorities established in the Water Resources Master Plan of the Republic of Serbia. These national funds are augmented by IFI loans and EU supporting funds. EU financial help has only just started as part of the pre-accession phase.


Cost Recovery and Affordability

Cost recovery. The low price of water barely covers operating and maintenance costs. The price of drinking water and wastewater is very low at €0.48 /m3, or 1.2% of the average household budget. Such a low price barely covers the full cost of operation and maintenance. As a result, some utilities have significant losses (Figure 8). Cross-financing between domestic and other sectors and subsidizing from the municipality are commonplace. There is a provision that all municipal tariff increases need to be approved by the central government and that they should not exceed the official target rate for annual inflation. This measure makes it more difficult for municipalities to recover the water service cost, and may place an additional burden on central and local government finances. Tariffs and fines for wastewater discharge above authorized limits are very low compared to treatment facility costs, and sanctions for noncompliance are not enforced. Thus, there are no adequate incentives for the industrial and domestic sectors to comply with existing regulations.
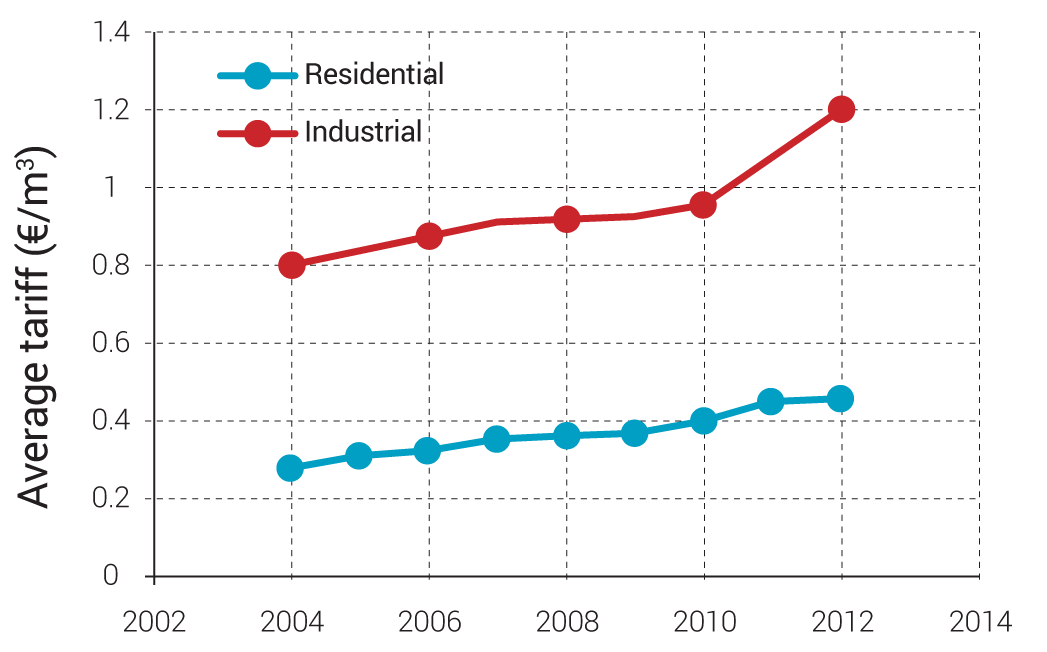
Tariffs. Water tariffs have increased but remain low. Average residential tariffs are lower than the regional average. Residential tariffs increased on average by 12% annually between 2004 and 2012 (Figure 9), while inflation reached an annual average of 10% during the same period. Tariffs are expected to continue to increase, given the significant investments and subsequent operating costs linked with Serbia meeting the EU environmental acquis.

Affordability. Affordability is not yet a constraint, but may become so for segments of the population. In 2012, the potential water bill for an average family was around 1.2% of their household income, and 1.9% of income for the bottom 40%. Potential affordability issues may arise in the future, however, due to investments needed to comply with the acquis. Indeed, tariffs will most likely rise, because investments must double during the next 15 years. However, the tariff increase should remain limited as long as the inflation price cap remains in force.
Figure 9: Evolution of average tariff (absolute and share of potential expenditure in income)
 |
|

Source: Authors’ elaboration.
Water Sector Sustainability and Main Challenges
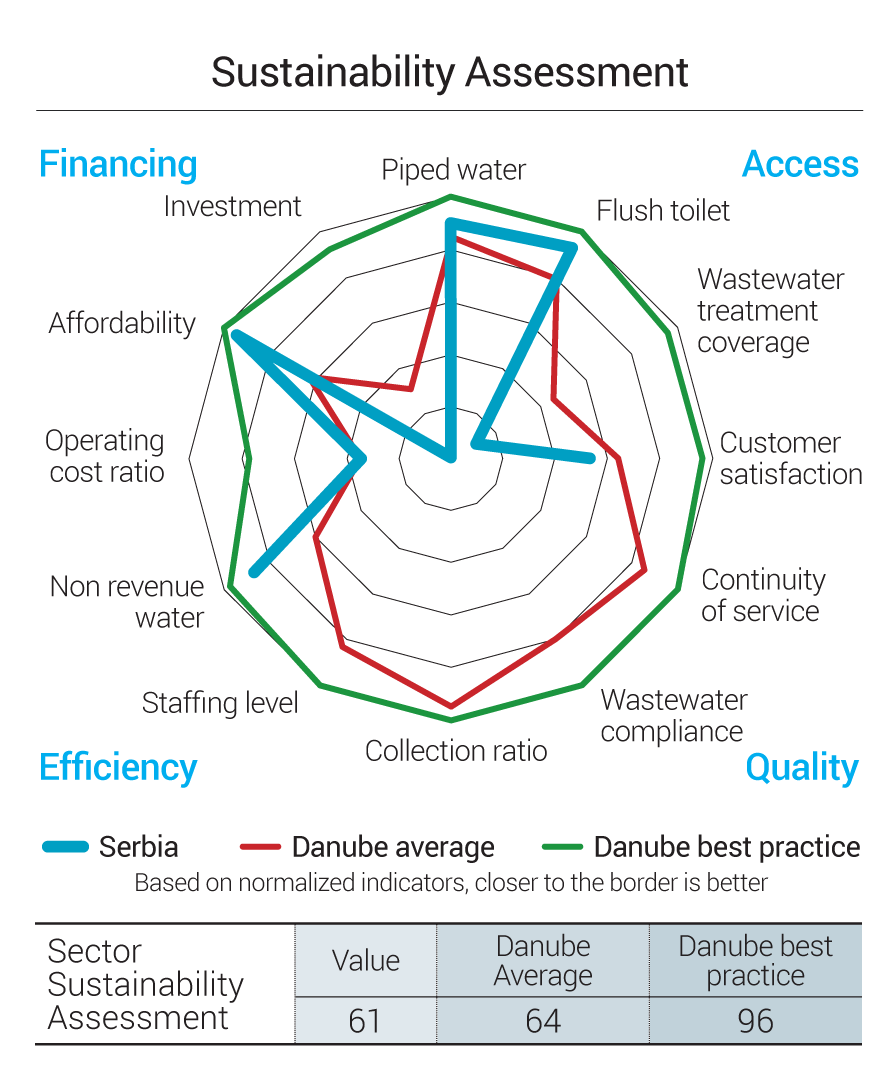
To evaluate the sustainability of services in the region, an overall sector assessment has been done taking into account four main dimensions: access to services, quality of services, efficiency of services, and financing of services. Each of these dimensions is measured through three simple and objective indicators.
For each indicator, best practice values are established by looking at the best performers in the region, and the countries closest to those best performers are deemed to have a more mature sector. A more complete description of the methodology to assess sector sustainability is included in the Annex of the State of the Sector Regional Report from the Danube Water Program. The outcomes of this assessment for the Serbian water sector are presented in Figure 10, which also shows average and best practices in the Danube region. The Serbian sector sustainability score is 61, which is below the Danube average sustainability of 64. The assessment shows that, on average, the country performs well in terms of access to piped water and flush toilets, nonrevenue water, and affordability. The main deficiencies of the Serbian water sector identified through the sector sustainability assessment are the level of investment, wastewater treatment coverage, and the operating cost ratio (Figure 10).

The main sector challenges are:
-
Strengthening and clarifying sector governance. To address overlapping mandates among ministries in charge of water sector policies and regulation, a clarification and definition of roles and duties is needed at the national level to improve water policy efficiency. Such a clarification will be particularly important to ensure an effective EU negotiation and accession process and a successful and sustainable infrastructure build-up. This would also fulfil the need for much broader involvement of all stakeholders in the process of planning and decision making in water and wastewater management.
-
Ensuring tariff setting according to the cost recovery principle to improve overall performance in preparation for EU accession. Due to the inflation cap imposed by the Ministry of Finance since 2004, water tariffs in Serbia are kept very low, which prevents utilities from recovering production costs, not to mention capital expenditure. As a result, some utilities have significant losses, assets are not being properly managed and replaced; and conditions are not in place for the significant infrastructure development necessary to comply with the EU environmental acquis. To increase wastewater treatment capacity, important investments are required to induce raising capital and operating costs. EU funds and IFI loans may partly alleviate these funding challenges, but the operating cost coverage ratio will have to increase and tariff-setting provisions may have to be revised. Moreover, costs could be controlled by decreasing operational inefficiency. This could be accomplished by reducing excess staffing, improving leak detection (to reduce technical losses), cracking down on illegal connections, improving collection enforcement, and extending metering.
-
Enhancing water utility staff capacity and training. In addition to financing challenges, the education and training of staff at all levels of water utilities is key to ensure long-lasting operational efficiency and sustainability of the water sector. Local governments and their associated bodies generally lack adequate skills to prepare and perform oversight.
Sources
-
Batut. 2010. Health Statistical Yearbook of the Republic of Serbia 2010. Belgrade: Institute of Public Health of Serbia “Dr Milan Jovanovic Batut.”
-
Eurostat. 2014. European Commission Directorate-General Eurostat: Statistics Explained - Water Statistics. Accessed 2015. http://ec.europa.eu/eurostat/statistics-explained/index.php/Water_statistics.
-
FAO Aquastat. 2015. Food and Agriculture Organization of the United Nations - AQUASTAT Database. Accessed 2015. http://www.fao.org/nr/water/aquastat/data/query/index.html?lang=en.
-
Gallup. 2013. World Poll. Accessed 2015. http://www.gallup.com/services/170945/world-poll.aspx.
-
ICPDR. 2015. International Commission for the Protection of the Danube River. Accessed 2015. http://www.icpdr.org.
-
IPM. 2015. Inter-institutional professional network in water sector of Serbia. Accessed 2015. http://www.ipm.org.rs/home/index.php?lang=en.
-
MAFWM. 2013. Official data of the Republic Directorate for Water. Belgrade: Ministry of Agriculture, Forestry and Water Management of the Republic of Serbia.
-
MEMSP. 2011. National Environmental Approximation Strategy for the Republic of Serbia. Belgrade: Ministry of Environment, Mining and Spatial Planning of the Republic of Serbia.
-
MESP. 2010. Initial National Communication of the Republic of Serbia under the United Nations Framework Convention on Climate Change. Belgrade: Ministry of Environment and Spatial Planning of the Republic of Serbia.
-
MHMR. 2010. Strategy for Improvement of the Status of Roma in the Republic of Serbia. Belgrade: Ministry of Human and Minority Rights of the Republic of Serbia.
-
MISP. 2011. Draft Strategy for Restructuring Public Utility Companies in the Republic of Serbia. Belgrade: Municipal Infrastructure Support Programme.
-
NSRS. 2014. Law on Ministries (“Of. Gazette RS”, No. 44/2014). Belgrade: National Assembly of the Republic of Serbia.
-
NVE. 2013. Effects of climate change in the Kolubara and Toplica catchments, Serbia. Oslo: Norwegian Water Resources and Energy Directorate.
-
PKS. 2013. Integrated Report of Associations for Communal Activities. Belgrade: Chamber of Commerce and Industry of Serbia.
-
PWMC. 2015. “Vojvodinavode” - Public Water Management Company. Accessed 2015. http://www.vodevojvodine.com.
-
RAPP. 2010. Spatial Plan of the Republic of Serbia. Belgrad: Republic Agency for Spatial Planning.
-
RZS. 2011. Census 2011. Belgrade: Statistical Office of the Republic of Serbia.
-
—. 2012a. Eco-bulletin 2011. Belgrade: Statistical Office of the Republic of Serbia.
-
—. 2012b. Statistical Yearbook of Serbia 2012. Belgrade: Statistical Office of the Republic of Serbia.
-
—. 2014. Statistical Pocketbook of the Republic of Serbia 2014. Belgrade: Statistical Office of the Republic of Serbia.
-
SBRA. 2015. Serbian Business Registers Agency. Accessed 2015. http://www.apr.gov.rs.
-
UNDP Bratislava. 2012. UNDP/World Bank/EC Regional Roma Survey 2011. Bratislava: United Nations Development Programme Bratislava Regional Centre.
-
UTVSI. 2007. Overview of Water and Wastewater Tariffs, Work Material. Belgrade: Association for Water Technology and Sanitary Engineering.
-
World Bank. 2013. Serbia, Municipal Finance and Expenditure Review. Washington DC: World Bank.
-
—. 2015. World Development Indicators. Accessed 2015. http://databank.worldbank.org/data/views/reports/tableview.aspx.