 MOLDOVA
- Water Snapshot
- Context for Services
- Organization for Services
- Access to Services
- Performance of Services
- Financing of Services
- Water Sector Sustainability and Main Challenges
- Sources
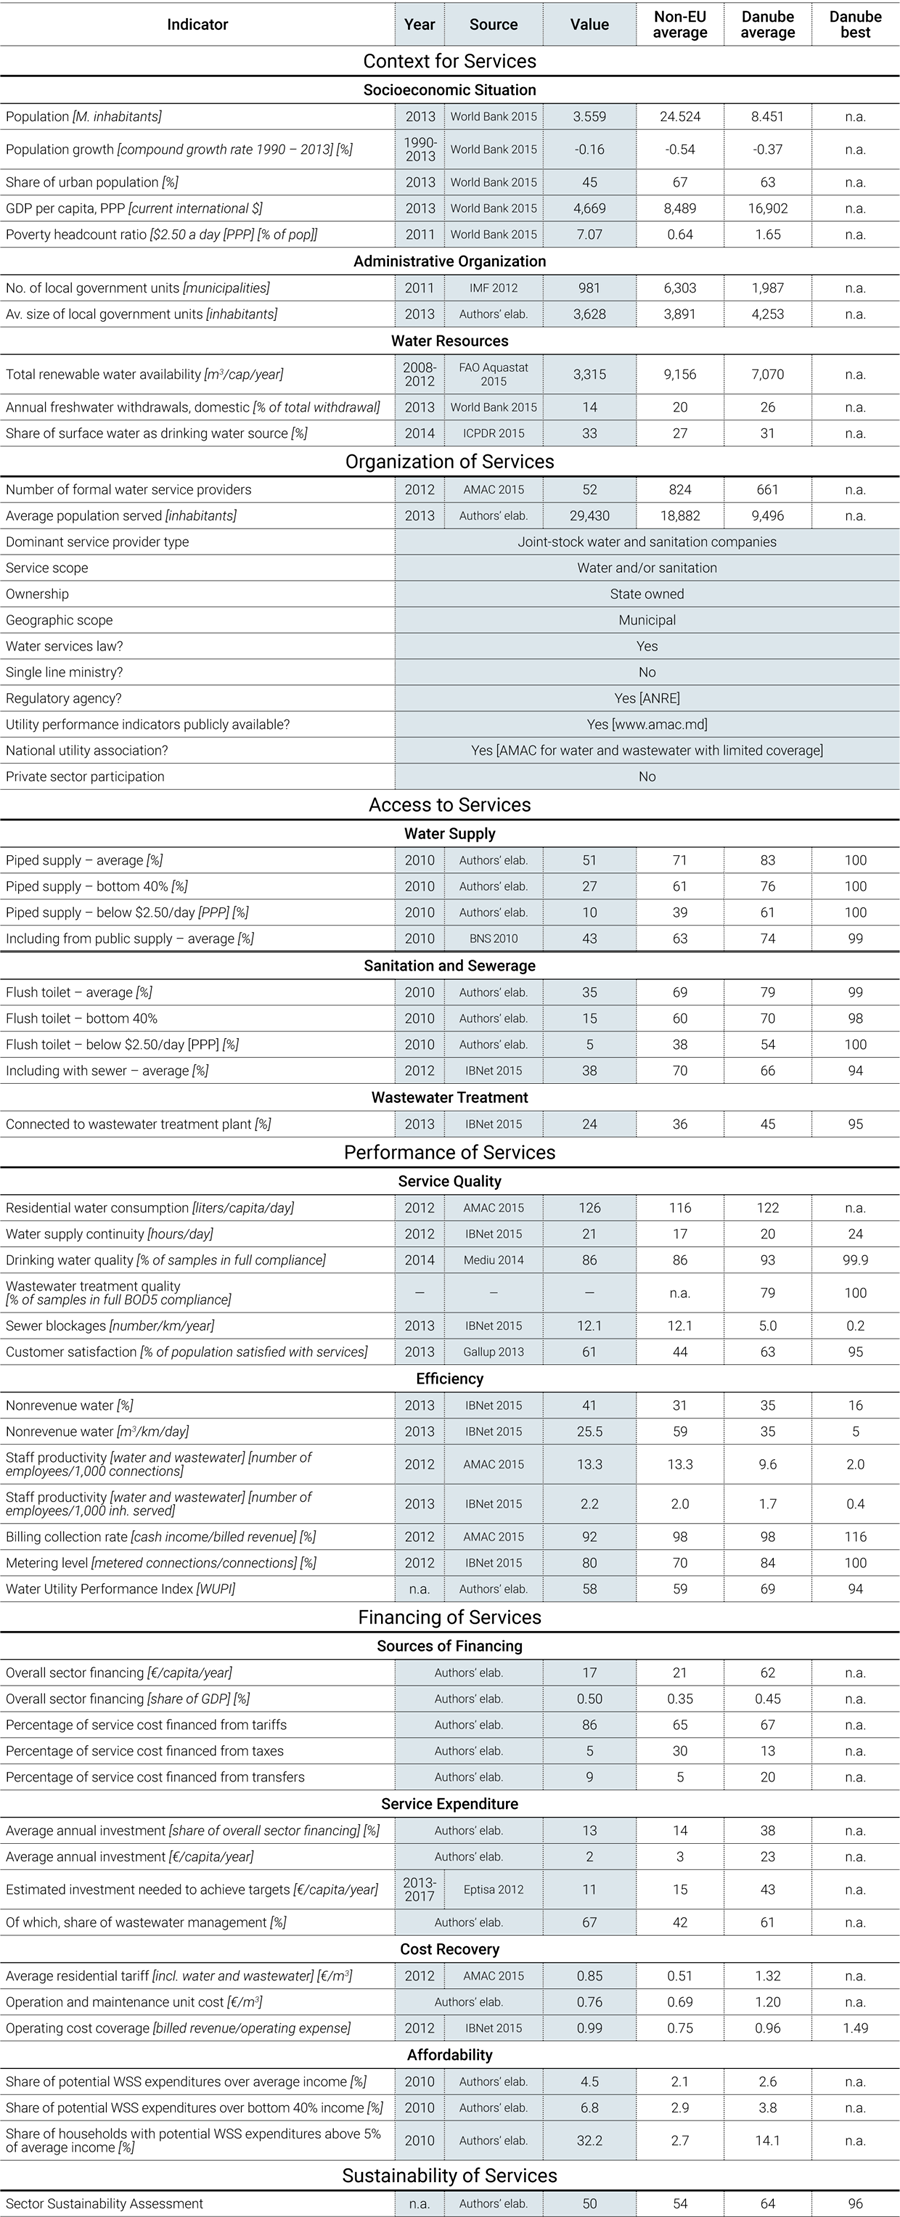
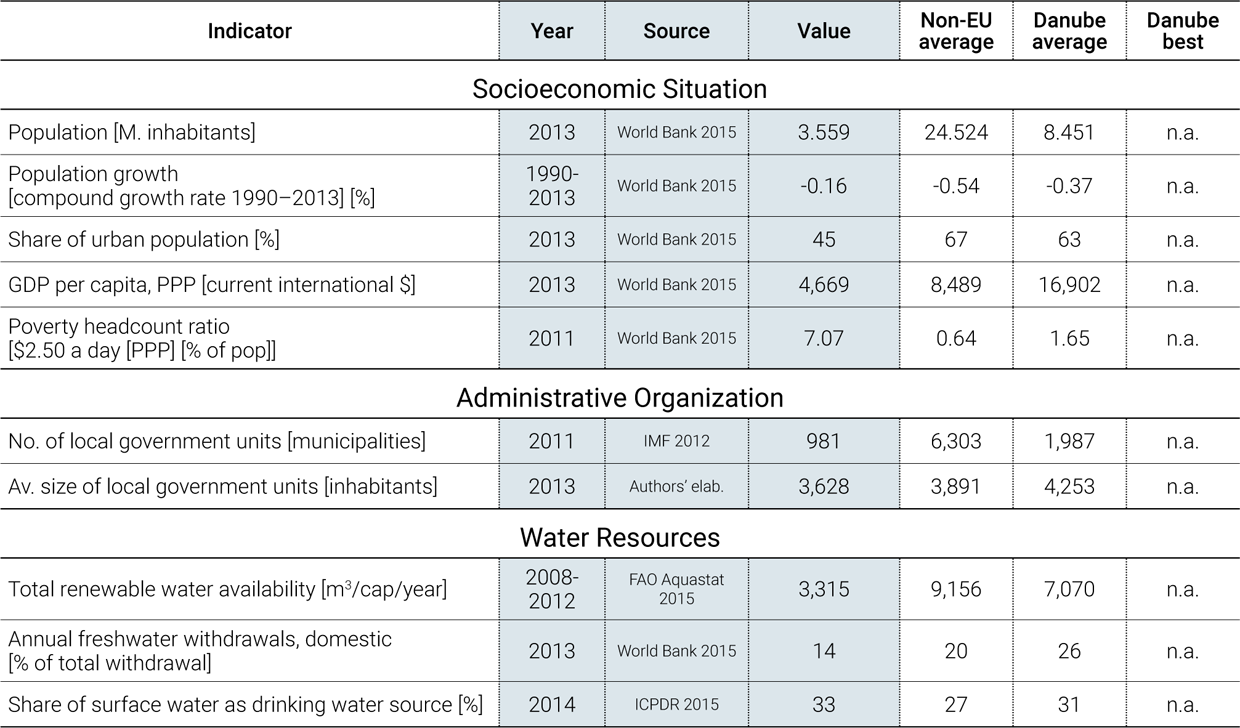
WATER SNAPSHOT
Sources for all numbers in the snapshot are provided in full in the body of this country page; a complete description of the methodology is provided in the State of the Sector Regional Report available under SoS.danubis.org/Report.
 |
 |
KEY WATER AND SANITATION SECTOR CHALLENGES
- Improving access to piped water and adequate sanitation. In rural areas, 1.5 million inhabitants do not have access to piped water and 1.8 million do not have access to flush toilets. Thus, access to safe drinking water and proper sanitation is one of the major challenges for the water sector in Moldova.
- Financing investments to upgrade the water and wastewater sector infrastructure. Over the next 15 years, €705 million will be needed to accomplish the goals of the New Strategy for the water sector. This will require increasing current investments by a factor of five.
- Addressing affordability issues regarding water and sanitation prices. Affordability of water is potentially an issue for a majority of the Moldovan population, with the average share of potential water and sanitation expenditures at nearly 5%, raising concerns about the feasibility of extending utility networks toward unserved populations. The upcoming investment efforts, which will require tariff increases, could exacerbate the affordability issue in the future.
FURTHER RESOURCES
On water services in the Danube Region
- A regional report analyzing the State of Sector in the region, as well as detailed country notes for15 additional countries, are available under SoS.danubis.org
- Detailed utility performance data is accessible, if available, under www.danubis.org/database
On water services in Moldova
The following documents are recommended for further reading; the documents, and more, are available at www.danubis.org/eng/country-resources/moldova/
- AMAC. 2015. Asociatia Moldova Apa-Canal. Accessed 2015. http://www.amac.md.
- Eptisa 2012. Water Supply and Sanitation Strategy. Chișinău: Government of the Republic of Moldova.
- KPC. 2013. Assessing the Impact of Climate Change on Water Supply Sources and WSS Systems in Moldova and Inventory Possible Adaptation Measures (Task 1). Vienna: Kommunalkredit Public Consulting GmbH.
CONTEXT FOR SERVICES
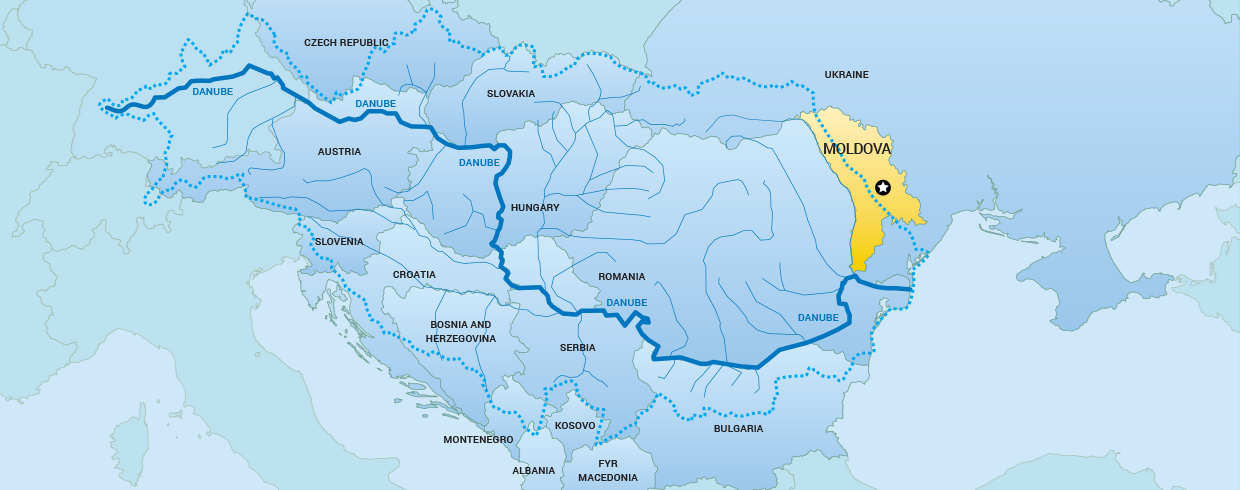
Economy. Moldova, whose economy relies heavily on agriculture, is one of the poorest countries in Europe. Moldova is a small country (33,843 km2) located in south-eastern Europe between Romania and Ukraine. Agriculture, including agroprocessing, represents about 30% of Moldova’s GDP and accounts for 40% of employment and about 60% of total exports. Moldova is a predominantly rural society; 55% of its 3.56 million inhabitants live in rural villages and 45% in urban areas. Twenty percent of the population lives in Chisinau, the capital (BNS 2013). With a per capita GDP of US$4,669 (PPP), Moldova is the poorest country in Europe (World Bank 2015). Poverty is most severe in rural areas, and especially among the Roma minority, who represent 0.4% of the population (UNDP Moldova 2007). The relationship between Moldova and the EU is shaped through the European Neighbourhood Policy; the two entities signed an Association Agreement in 2014.
Governance. The Republic of Moldova is a unitary parliamentary representative democracy. The country is divided into 32 districts and has 982 incorporated localities (5 municipalities, 61 cities, and 916 communes) (BNS 2014). In addition, some 699 rural villages, which are too small to have their own administrations, are attached to nearby cities or communes (BNS 2013). Water and sanitation services provision has been decentralized to municipalities, according to the Law on Public Services of Communal Management (2002) (PRM 2002). However, there is currently a trend toward the development of regional operators supplying services at the district level.
Water resources. Moldova is facing important quality issues for both surface and underground waters, which climate change may worsen. The basin of the Dniester River and its tributaries covers about 67% of Moldovan territory and the Pruth River basin approximately 24% (Mediu 2009). The water quality of both rivers has improved with the collapse of the Soviet Union and the slowing of economic activity. But although the water quality is relatively stable, it deteriorates downstream due to discharges from industries and households. Most internal rivers are highly polluted and contain large amounts of minerals that make them unsuitable for drinking water purposes. Other surface waters include artificial and natural lakes and ponds, with a tendency for high salinity and mineralization, which often leads to eutrophication. More intense transboundary water management is still needed among Moldova, Transnistria, and Ukraine to coordinate water resources preservation and water pollution control. More than 90% of Moldovan wells have one or more chemical constituents that exceed national drinking water standards, including hardness (90%), total dissolved solids (65%), nitrates (55%), sulfates (55%), selenium (40%), fluoride (15%), and chloride (10%). Over 80% of the wells have positive and high concentrations of E. Coli (OECD 2007).
In 2013, the EU financed a study on the impact of climate change on water supply sources and services in Moldova. Floods and droughts were identified as major risks for water and sanitation services, as were other weather- and water-related hazards such as storms, extreme winter temperatures, and landslides. The immediate impact of floods on water infrastructure relates to increased water stream at intake facilities that require proper physical protection, and to flooding of treatment facilities and/or pumping stations located close to rivers or in exposed areas. Droughts also impact water quality, because they result in lower dilution of pollution loads, especially in the Prut and Nistru Rivers (KPC 2013).
Water supply sources. Surface water is the main source of drinking water supply for urban areas, and underground water is the main source for rural areas. Currently, 65% to 70% of total water is used for industrial heating and cooling and for hydropower production, 15% to 20% for drinking and domestic purposes, and 5% to 10% for irrigation (UNDP 2009). All internal rivers are seasonal, becoming dry during summer months, with a high level of mineralization and pollution, making them unsuitable for conventional drinking water sources. Underground water is the main source of raw water to produce potable water in Moldova, and it supplies 100% of the rural population, 30% of the urban population, and 65% of the total population in the country (Mediu 2009). Surface water is used for water provision in 70% of urban areas. Continuous degradation of drinking water quality is due to increased livestock raising in households, agricultural and municipal waste storage and landfills, and infiltration of polluted waters.
ORGANIZATION FOR SERVICES


Service provision. Municipal utilities are in charge of water provision. Currently, 52 municipally owned operators provide water and sanitation services to 43% of the population mainly located in urban areas. The rest of the population relies on self-provision (Figure 1).
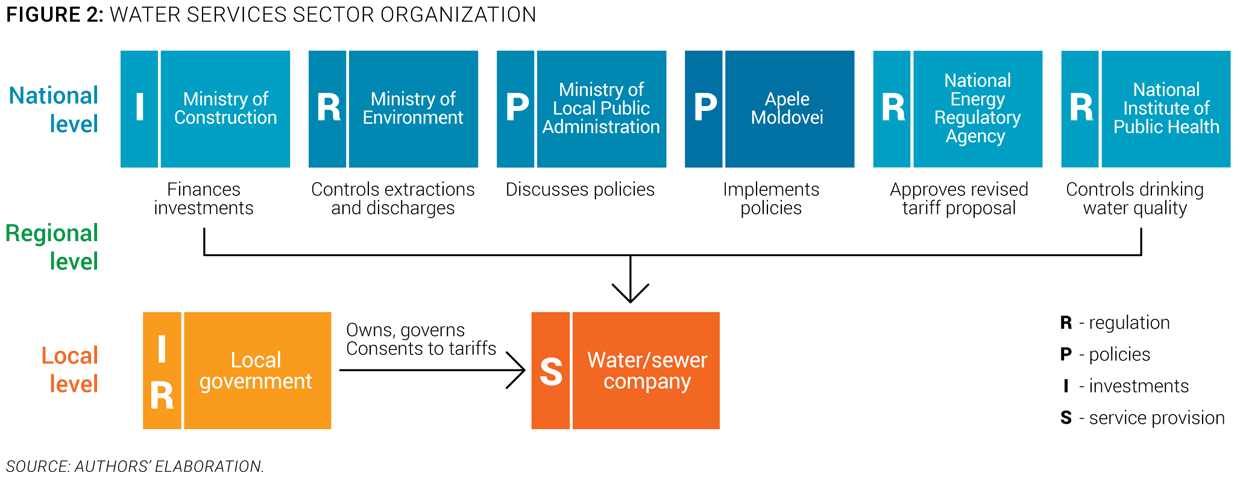
Policy-making and sector institutions. Several ministries regulate the water sector. The national institutional framework in the water sector is divided among the following three ministries and one agency, with no clear line ministry and some overlapping responsibilities (Figure 2):
- The Ministry of Environment, which is responsible for the development of the regulatory framework for environmental protection, including water resources, water supply, and sewerage systems. The State Ecological Inspection, which is subordinated to the Ministry of Environment, is in charge of controlling and monitoring water quality. It issues permits and collects the water tax on water abstraction from operators and industries (Mediu 2014a).
- The Agency “Apele Moldovei” (Moldovan Waters), which is a subdivision of the Ministry of Environment and is responsible for implementing the water and sanitation services policy in rural and urban areas (Apele Moldovei 2015).
- The Ministry of Local Public Administration, which is responsible for policy and planning in the water and sanitation sector (Gov. MD 2014).
- The Ministry of Regional Development and Construction, which is responsible for implementing the regional development policy. Three Regional Development Agencies created in 2010 are the key institutions in charge of coordination and planning of investment projects (MDRC 2015).
- The National Energy Regulatory Agency (ANRE), which is responsible for water tariff review. ANRE is managed by an Administrative Board with 5 directors appointed for 6 years. One of these directors is chosen by the Parliament to be the General Director of the Administrative Board (ANRE 2014).
- The National Center of Public Health, which is responsible for monitoring both drinking water quality and wastewater effluent quality (CNSP 2014).
Capacity and training. Improvement of water utility staff training and capacity is key to enhancing water utility management and performance. The water sector in Moldova suffers from a lack of specialized staff with experience in water infrastructure management and implementation of investment projects. Municipal representatives appoint utility management staff who have no specific qualifications or competencies. Technical water sector staff receive no training. The national water association, Asociatia Moldova Apa-Canal (AMAC), created in 2000, has limited coverage over the Moldovan territory and little capacity to promote knowledge and best practices. Incentives should be created to foster sector performance as a key element of utility governance.
Economic regulation. Tariffs are regulated through a revenue cap methodology. The water sector in Moldova is regulated by the National Energy Regulatory Agency, a multisector regulator created under the 2002 Law on Public Service of Communal Management, which received the responsibility to oversee the water services sector in 2014. Tariffs are revised upon request of utilities, which submit a new tariff proposal to their local authority. The new tariff proposal is reviewed by the National Energy Regulatory Agency according to a revenue cap methodology devised in 2004 for tariff calculation for water supply, sewage, and wastewater treatment.
Ongoing or planned reforms. Access to safe drinking water and proper sanitation is among the main goals of the New Water Strategy. Within the context of ratification of the Association Agreement between Moldova and the EU, the government adopted a new water supply and sanitation strategy for 2014-2028. The strategy sets targets regarding the extension and rehabilitation of the water and sanitation infrastructure, and objectives for information provision and the water governance framework, with the long-term goal the regionalization of water utilities. The main goal of the New Water Strategy in the short term, however, is to ensure, on a phased basis, access to safe drinking water, and to adequate sanitation in all settlements throughout the country.
ACCESS TO SERVICES

Service coverage. There are serious disparities in service access between urban and rural areas. Fifty-one percent of the population has access to piped water supply and 43% to public water supply (Figure 3) (BNS 2010). However, there are significant coverage differences between urban and rural areas. Whereas piped water supply coverage is 87% in cities, it drops to 25% in rural settlements (BNS 2010). In urban areas, 50% of the population is connected to a public collective sanitation system, with rates ranging from 30% to over 80% in the capital, Chișinău (Eptisa 2012). Only 5% of the rural population is connected to a wastewater collection system, and no rural wastewater is treated (Eptisa 2012). Eleven percent of inhabitants in rural villages use unimproved sanitation solutions, causing major risks of health hazards and environmental pollution (WHO/UNICEF 2015).
Moldova Data Availability
Data regarding urban utilities are readily available. As members of the AMAC, most urban water utilities regularly share current functional and financial information. Almost no data on service coverage or operational information are available for the rural water sector, however, and the quality of the little that exists varies considerably. Water utilities equipped with flow meters and domestic water meters provide accurate data on water production and consumption and on nonrevenue water. Data reliability of utilities using outdated metering and measurement devices is, however, poor.
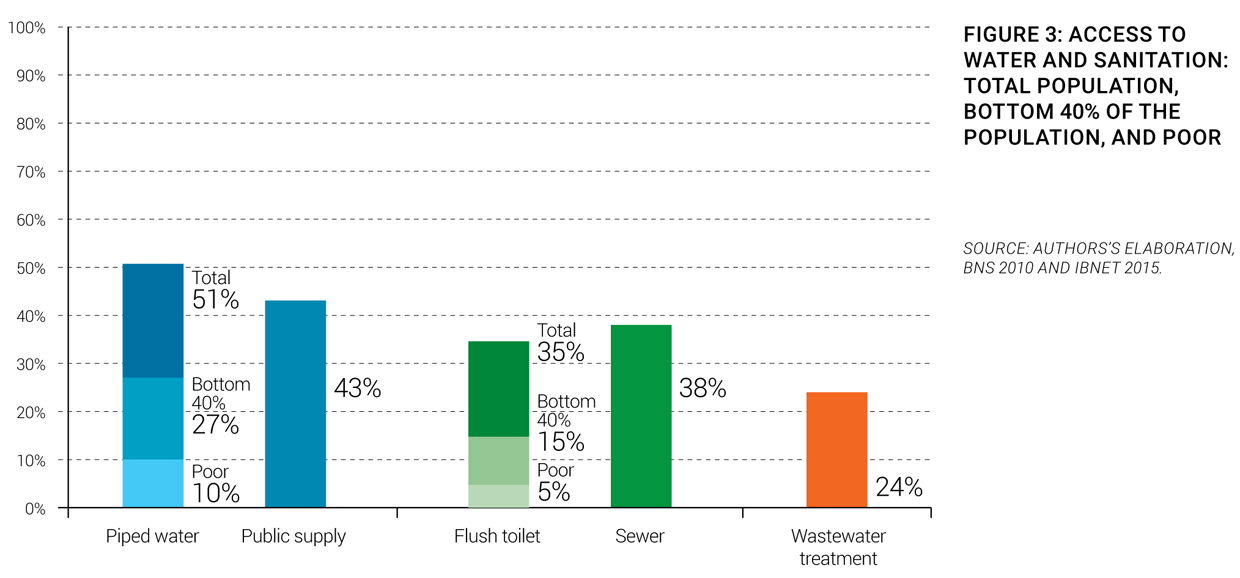
Equity of access to services. Access to water supply and sanitation facilities is very low for Roma households and for the poorest segment of the population. Only 27% of the bottom 40% of the population has access to piped water, and 15% to flush toilets (BNS 2010). Only 10% of the poorest share of the population—those living on less than $2.50 a day—has access to piped water supply and 5% to flush toilets (BNS 2010). According to a 2007 UNDP report, housing deprivation of Roma households is much higher than for the rest of the population. One-third of Roma households live in an insecure dwelling, and more than 80% do not benefit from basic housing conditions such as potable water supply and sanitation facilities (UNDP Moldova 2007).
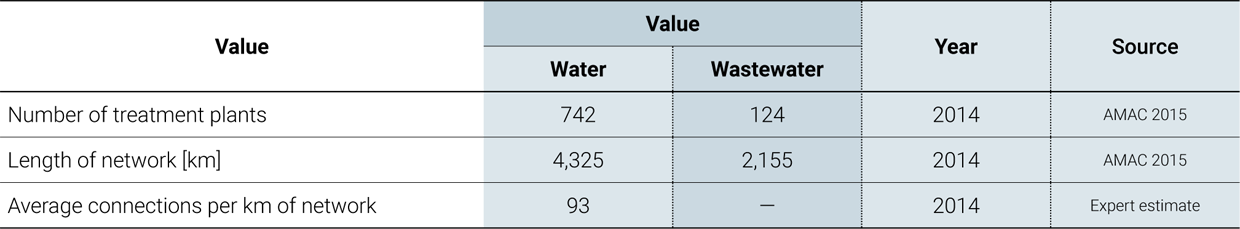
Service infrastructure. Water infrastructure is deteriorating, but efforts are being made to halt the deterioration. The water sector in Moldova is operating with an outdated infrastructure. Equipment is in poor condition and has limited capacity. In 2009, there were 644 water supply systems, of which only 562 were operational. By 2012, the situation had improved, with 677 of 742 water systems operational. However, 83% of the 271 pumping stations are in unsatisfactory condition. There are 158 wastewater sanitation systems of which 110 are operational. The water and sewage distribution network is 8,994 km long, of which 3,725 km are in bad condition (Mediu 2014a and AMAC 2015).
PERFORMANCE OF SERVICES
Service Quality

Quality of service. Although quality of service has improved, drinking water quality remains a priority for public health. Water service continuity has nearly doubled over the last decade to 21.3 hours per day in 2012 (Figure 4) (IBNet 2015 based on a sample of 41 water utilities). However, drinking water quality remains a major issue in Moldova; 10% to 14% of samples fail to comply with microbiological requirements (Mediu 2014b). An estimated 22% to 25% of diarrheal diseases, 15% to 20% of viral hepatitis A, and 100% of fluorosis are caused by poor drinking water quality (Mediu 2014b). This situation is aggravated by the lack of adequate laboratories to regularly test tap water quality.
Customer satisfaction. The satisfaction of the population with the service provided in their country is low, at 61%. This number is lower than in most countries in the region (Gallup 2013).

Efficiency of Services

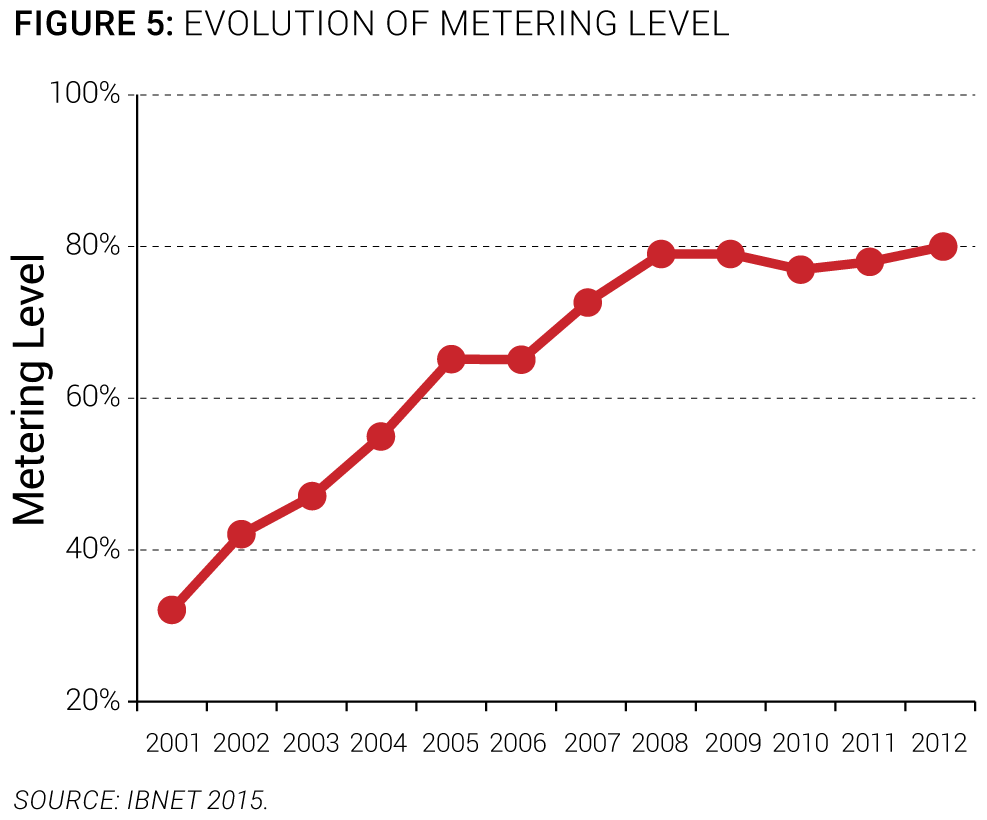
Overall efficiency. Water utilities are steadily increasing their efficiency, but there remains room for improvement. Overstaffing is a persistent issue in Moldovan water utilities, as shown by AMAC statistics, which include data from member utilities. With an average of 13.3 staff per 1,000 connections in 2012, staff productivity remains low compared to international best practices of 1 to 2 staff per 1,000 connections (AMAC 2015). The metering level of customers is high, at 80% in 2012 (IBNet 2015), as is the billing collection rate, which was 92% the same year (AMAC 2015). This shows a capacity to recover billed invoices and generate revenues for the service. Yet most water operators are in a negative spiral of rising costs of water supply and sewerage, deterioration of fixed assets, insufficient spending on efficient technologies and equipment, high unit costs of electricity, and high nonrevenue water (41% in 2012) (IBNet 2015). Efficiency varies considerably among utilities, and there are important contrasts between the well-performing and improving Chisinau utility and the rest of the urban utilities, which are much less efficient and whose condition is deteriorating.
 |
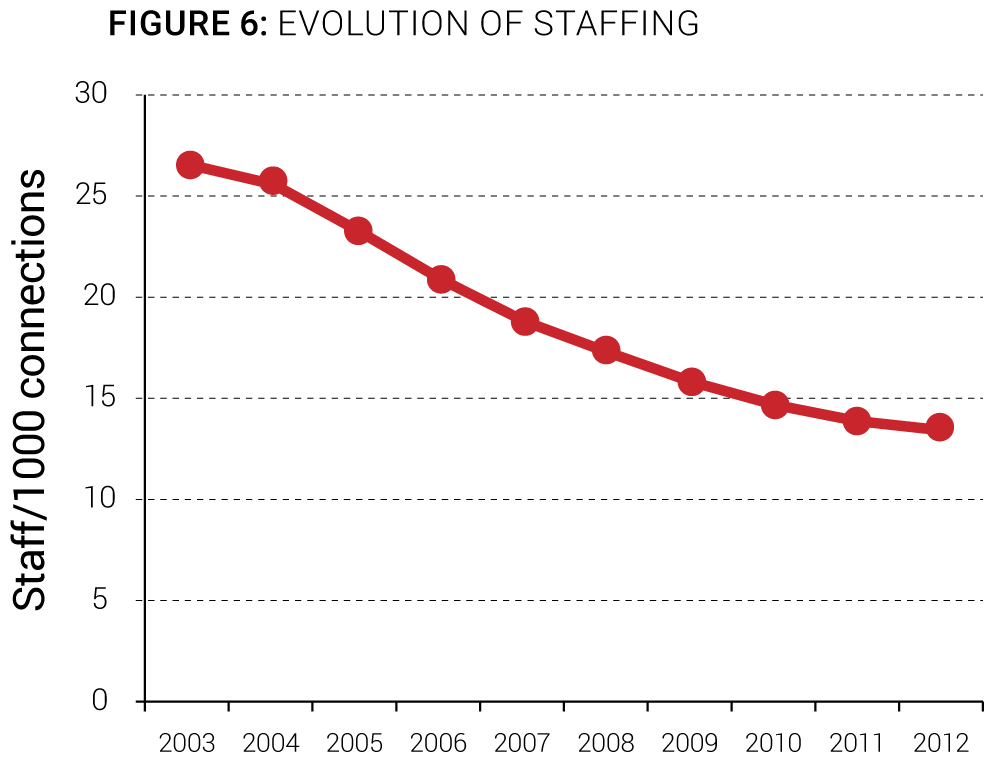 |
Recent trends. Water and sanitation services have achieved significant efficiency gains over the last decade, which should continue. Although water and sanitation services operate with limited operational and financial capacity, they have been able to significantly increase their efficiency over the last decade. From 2001 to 2012, the metering level has been multiplied by 2.5 (Figure 5) (IBNet 2015). Such an evolution seems to have encouraged rational consumption behavior on the part of consumers, since water consumption decreased by 40% over the same period (AMAC 2015). Overstaffing has gradually diminished since 2003, dropping from 23.6 to 13.3 staff per 1,000 connections (Figure 6) (AMAC 2015). This increase in productivity, partly deriving from the revenue cap methodology for tariff setting, has lowered the burden of staff expenditure on overall operating expenditures, but overstaffing needs to be further reduced. The level of nonrevenue water has remained stable over the last 10 years, showing no improvement in network maintenance or replacement. Clearly, efficiency gains are still needed in this area (IBNet 2015).
FINANCING OF SERVICES
Sector Financing
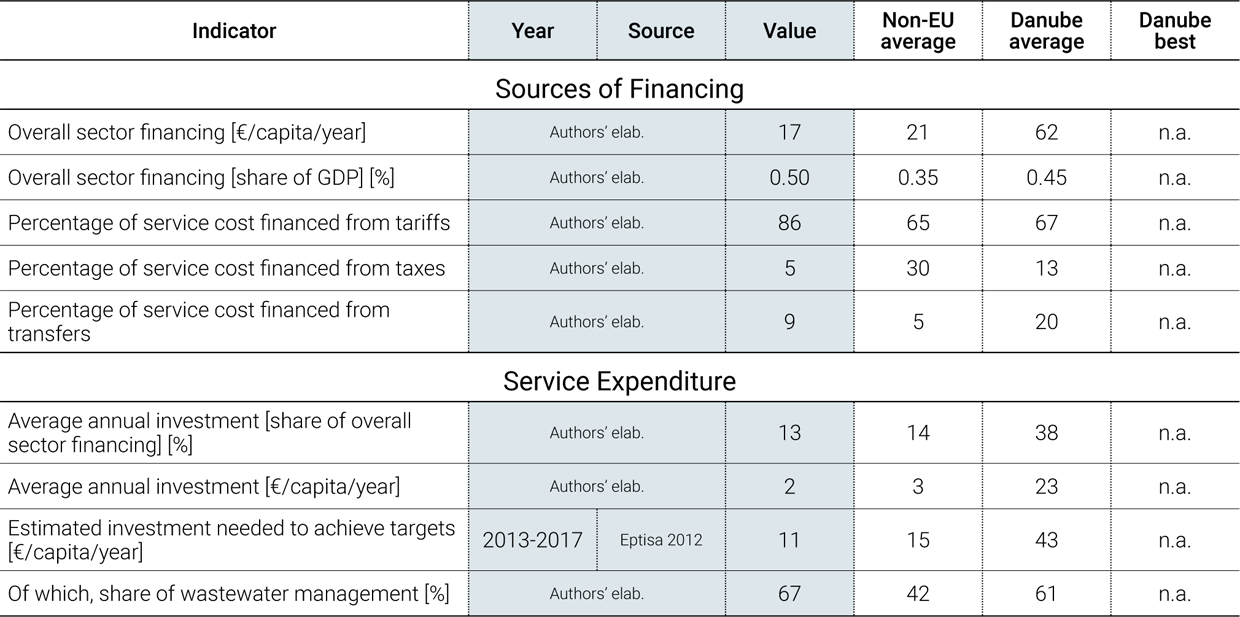
Overall sector financing. Tariffs are the main source of funding, and they cover operation and maintenance costs. However, since tariffs are being kept low, they only allow for minimal operation and maintenance. To fund investments, revenues collected by utilities are augmented by subsidies from both national and local budgets, and some international grants and loans (Figure 7).
The main sources of funding of water and wastewater utilities are described in Figure 8 , using the OECD three Ts methodology (tariffs, transfers, and taxes).
Investment needs. A significant increase in investment is planned over the next 15 years. Within the framework of the New Strategy for the water sector, investment needs have been assessed for the next 15 years. They amount to €705 million, of which €194 million should be invested in the next five years (2014-2018), or €11/capita/year.

According to New Strategy supporting documents, this should be achieved by an average annual increase of 5% in consolidated grants from national and local budgets, assuming a stable contribution from foreign funding sources (€19 million to €21 million/year). Among other objectives, these investments aim at extending water and sewer networks, increasing the number of users connected to water and sewerage public utilities, and rehabilitating and building water and wastewater treatment plants (Eptisa 2012).

Investments. The current level of investment is too low to match water sector needs. During 2009-2013, €12 million was invested annually in the water sector in Moldova, which represents a very low contribution of only €2/capita/year (AMAC 2015). This amount is only 0.02% of nominal GDP compared to the 1.2% to 6% recommended by the OECD for low-income countries (OECD 2011). Two-thirds of the investments were financed by international donors and one-third by national and local budgets. National grants are allocated on a first come-first served basis, with no rational long-term planning strategy or any requirements regarding economic and technical assessment of projects.
Cost Recovery and Affordability
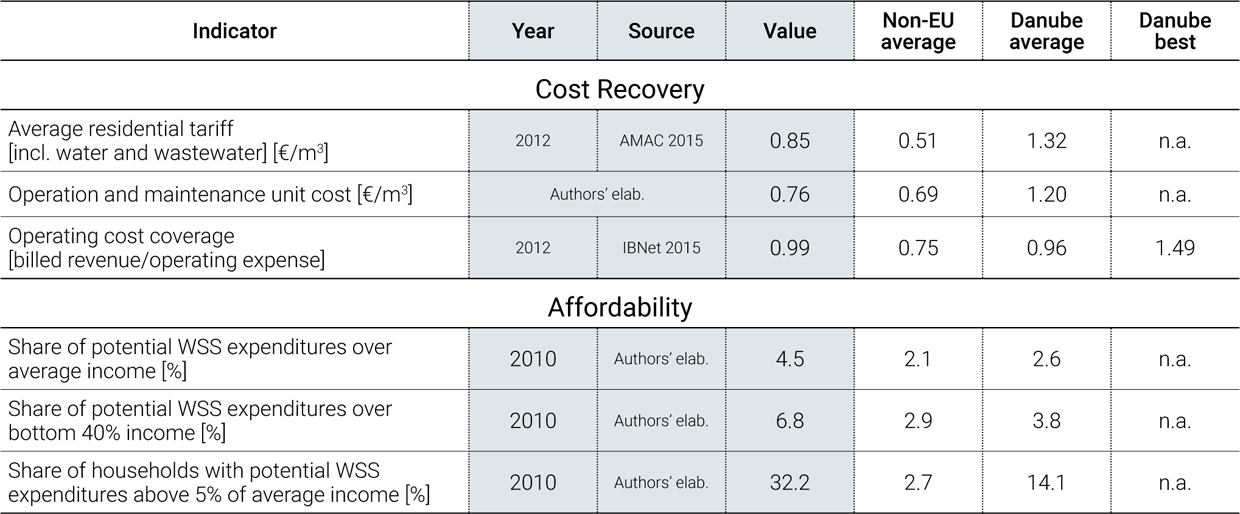
Cost recovery. Utility revenues are sufficient to cover their operating costs but are insufficient to fund the required investments. In 2012, the average operating ratio for the water sector was 0.99, indicating that utility revenues are almost sufficient to cover operating expenditures (IBNet 2015). These revenues can also finance a small portion of investments. However, due to very high operating costs and low water tariffs, the funds available for investments remain below sector needs. This affects the capacity of utilities to sustain the functionality of assets and service quality.
Floresti Communal Utility
Floresti Communal Utility (Servicii Comunale Florești), which provides services to 3 cities and 5 rural localities within Floresti district, is one of the most developed and rapidly expanding WSS providers in Northern Moldova. It has ambitious plans to become a regional operator.

Tariffs. In the last 10 years, water tariffs have increased above inflation and are still expected to increase. In 2012, the mean residential water and sanitation tariff was €0.85/m3 (AMAC 2015), which is in line with the Danube regional average. Water service provision represents 67% of the overall price, and wastewater service 33% (AMAC 2015). Since 2004, tariffs have doubled, while the average inflation rate was 9% per year, resulting in a real term increase of 2% to 3% per year (Figure 9). Tariffs are expected to continue to increase, given the significant investments and associated operating costs planned in the New Strategy for water and sanitation services for the next 15 years (Eptisa 2012).
Affordability. On average, potential water and wastewater charges represent 4.5% of household income. This matches the upper acceptable threshold proposed by the OECD. For the bottom 40% of the population, water charges potentially represent more than 6% of household monthly income, and for the poorest decile, 14% (Authors’ elaboration). This may introduce serious affordability issues, especially in light of the upcoming investment efforts requiring tariff increases. However, few households from the poorest decile are currently connected to public water services.
WATER SECTOR SUSTAINABILITY AND MAIN CHALLENGES
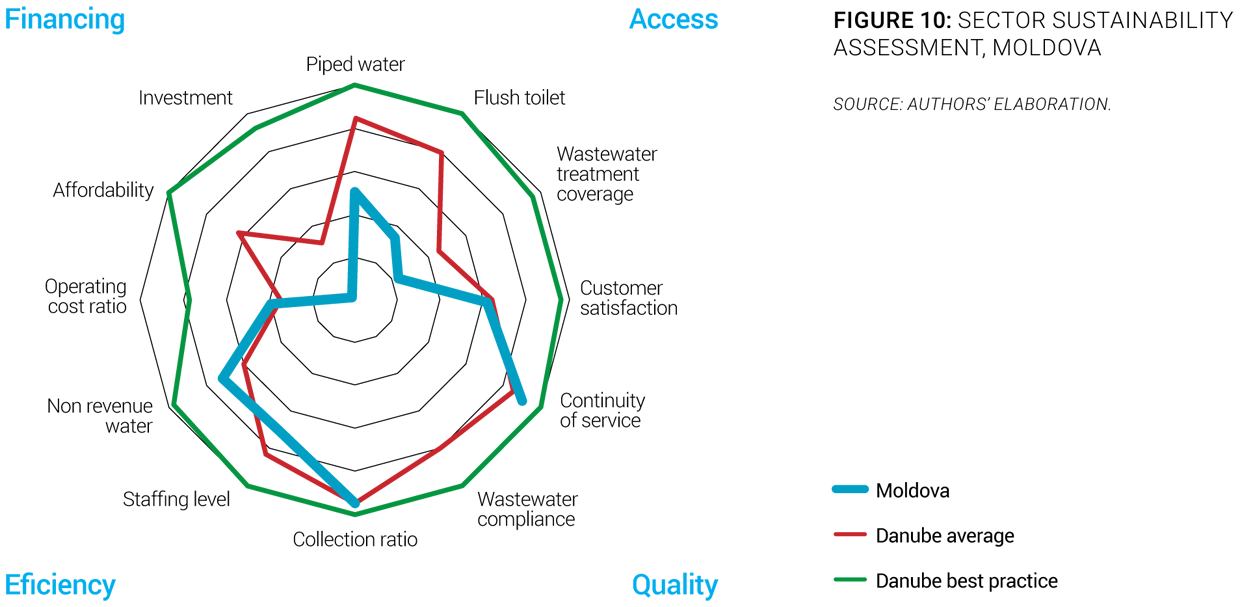
To evaluate and reflect the sustainability of services in the region, an overall sector sustainability assessment was done, taking into account four main dimensions: access to services, quality of services, efficiency of services, and financing of services. Each of these dimensions is measured through three simple and objective indicators. For each indicator, best practice values are established by looking at the best performers in the region, and countries closest to those best performers are deemed to have a more mature sector. A more complete description of the methodology to assess the sector sustainability is included in the Annex of the State of the Sector Regional Report from the Danube Water Program. The outcomes of this assessment for the Moldova water sector are presented in Figure 11, which also shows average and best practices in the Danube region. The Moldova sector sustainability score is 50, which is below the Danube average of 64, and is among the lowest scores in the region. The assessment shows that, on average, the country performs well in terms of collection ratio, nonrevenue water, and continuity of service. The main deficiencies of the Moldova water sector identified through the sector sustainability assessment are access to piped water and flush toilets, affordability, and investment level (Figure 10).
The main sector challenges are:
- Improving access to piped water and adequate sanitation. In rural areas, 1.5 million inhabitants do not have access to piped water and 1.8 million do not have access to flush toilets. Thus, access to safe drinking water and proper sanitation is one of the major upcoming challenges for the water sector in Moldova. These efforts are necessary to reduce health risks and environmental pollution through untreated discharges. In urban areas, extensions to existing systems and improvements of their reliability and efficiency will also provide health benefits to the population through the supply of safer drinking water and adequate sanitation.
- Financing investments to upgrade the water and wastewater sector infrastructure. Over the next 15 years, €705 million will be needed to accomplish the goals of the New Strategy for the water sector. This will require a major funding effort multiplying current investments by a factor of five. This increase should be covered by an average annual increase of 5% in consolidated grants from national and local budgets, assuming a stable contribution from foreign funding sources (Eptisa 2012). Efforts must also be made to improve the quality of drinking water, since the compliance rate is only 86%, and the effective level of wastewater collection and treatment.
- Addressing potential affordability issues regarding water and sanitation prices. The potential affordability of water is already an issue for a majority of the Moldovan population, with the average share of potential water and sanitation expenditures of nearly 5%. The upcoming investment efforts, which will require tariff increases, could exacerbate the affordability issue in the future.
SOURCES
- AMAC. 2015. Asociatia Moldova Apa-Canal. Accessed 2015. http://www.amac.md.
- ANRE. 2014. National Energy Regulatory Agency of the Republic of Moldova. Accessed 2015. www.anre.md.
- Apele Moldovei. 2015. Agency “Apele Moldovei”. Accessed 2015. http://www.apelemoldovei.gov.md.
- BNS. 2010. Household Budget Survey. Chișinău: National Bureau of Statistics of the Republic of Moldova.
- —. 2013. National Bureau of Statistics of the Republic of Moldova. Accessed 2015. http://www.statistica.md/index.php?l=en.
- —. 2014. Moldova in Figures. Chișinău: National Bureau of Statistics of the Republic of Moldova.
- CNSP. 2014. Moldova National Center of Health. Accessed 2014. http://cnsp.md.
- Eptisa. 2012. Moldova Water Utilities Development Program: Republic of Moldova’s Water Supply & Sanitation Strategy (Second Draft). Bucharest: Eptisa Romania SRL.
- FAO Aquastat. 2015. Food and Agriculture Organization of the United Nations - AQUASTAT Database. Accessed 2015. http://www.fao.org/nr/water/aquastat/data/query/index.html?lang=en.
- Gallup. 2013. World Poll. Accessed 2015. http://www.gallup.com/services/170945/world-poll.aspx.
- Gov. MD 2014. Government of the Republic of Moldova. Accessed 2015. http://www.gov.md/en.
- IBNet. 2015. The International Benchmarking Network for Water and Sanitation Utilities. Accessed 2015. http://www.ib-net.org.
- ICPDR. 2015. International Commission for the Protection of the Danube River. Accessed 2015. http://www.icpdr.org.
- IMF. 2012. Republic of Moldova: Selected Issues. Washington, DC: International Monetary Fund.
- KPC. 2013. Assessing the Impact of Climate Change on Water Supply Sources and WSS Systems in Moldova and Inventory Possible Adaptation Measures (Task 1). Vienna: Kommunalkredit Public Consulting GmbH.
- MDRC. 2015. Ministry of Regional Development and Constructions of the Republic of Moldova. Accessed 2015. http://mdrc.gov.md.
- Mediu. 2009. Second National Communication of the Republic of Moldava under the United Nations Framework Convention on Climate Change. Chișinău: Ministry of Environment and Natural Resources of the Republic of Moldova.
- —. 2014a. Ministry of Environment of the Republic of Moldova. Accessed 2015. http://mediu.gov.md.
- —. 2014b. Water Supply and Sanitation Strategy of the Republic of Moldova and Transition to Green Economy. Chișinău: Ministry of Environment of the Republic of Molodova.
- OECD. 2007. Facilitating Policy Dialogue, and Developing a National Financing Strategy for Urban and Rural Water Supply and Sanitation in Moldova. Paris: Organisation for Economic Co-operation and Development.
- —. 2011. Meeting the Challenges of Financing Water and Sanitation: Tools and Approaches. Paris: Organisation for Economic Co-operation and Development.
- PRM. 2002. Law on Public Services of Communal Management. Chișinău: Parliament of the Republic of Moldova.
- UNDP. 2009. Climate Change in Moldova. Socio-Economic Impact and Policy Options for Adaptation. National Human Development Report 2009/2010. New York City: United Nations Development Programme.
- UNDP Moldova. 2007. Roma in the Republic of Moldova. Chișinău: United Nations Development Programme Moldova.
- WHO/UNICEF. 2015. World Health Organization/United Nations Children’s Fund Joint Monitoring Programme (JMP) for Water Supply and Sanitation. Accessed 2015. http://www.wssinfo.org.
- World Bank. 2015. World Development Indicators. Accessed 2015. http://databank.worldbank.org/data/views/reports/tableview.aspx.