B. Socioeconomic Situation
11. With the change of political systems, as outlined in the previous section, Eastern European countries witnessed dramatic economic and demographic transitions. Having been closed to the movement of goods, services, people, and ideas under socialist rule, the opening of borders following the disuniting of the Former Soviet Union enabled people and money to move toward areas of economic opportunity, with resulting changes in GDP per capita and population at subnational levels.

12. The embracement of market-based economic principles and open borders generated sizable growth in the per capita GDP of several countries, with signs that economies farther away from markets are lagging behind. As can be discerned from Figure 3, above, differences in GDP per capita (current 2013 US$ purchasing power parity [PPP]) are still significant across the countries within the Danube watershed, with Moldova (at US$4,669) being the poorest, with one-tenth the per capita GDP of the richest country, Austria (at US$44,149).

13. Growth in GDP per capita was heterogeneous within countries. With respect to income, the bottom 40 percent of the population in Albania, Croatia, FYR Macedonia, Montenegro, and Serbia experienced lower GDP growth per capita compared to their respective country average, and, with the exception of Montenegro, those incomes even declined between 1 and 2 percent annually from 2005 to 2010, as shown in Figure 4. In contrast, households among the bottom 40 percent in Slovakia and Romania enjoyed annual increases in their incomes to more than double and triple the average, although transfers are estimated to explain almost 90 percent of the increase in Romania (Bussolo and Lopez-Calva, Shared Prosperity: Paving the way in Europe and Central Asia 2014, 37). While some countries register higher growth in incomes among their bottom 40 percent, most countries still have a long way to go to close the income gap between this group and the top 60 percent. The share of the bottom 40 percent in Bulgaria, Hungary, FYR Macedonia, Moldova, and Romania was less than 20 percent of total income, closely followed by Albania, Croatia, Kosovo, Montenegro, and Serbia, with about 22 percent (Bussolo and Lopez-Calva, Shared Prosperity: Paving the way in Europe and Central Asia 2014, 19). Even in Austria, the bottom 40 percent holds only about 23 percent of the total income (authors’ computation using EUSILC data from 2012).
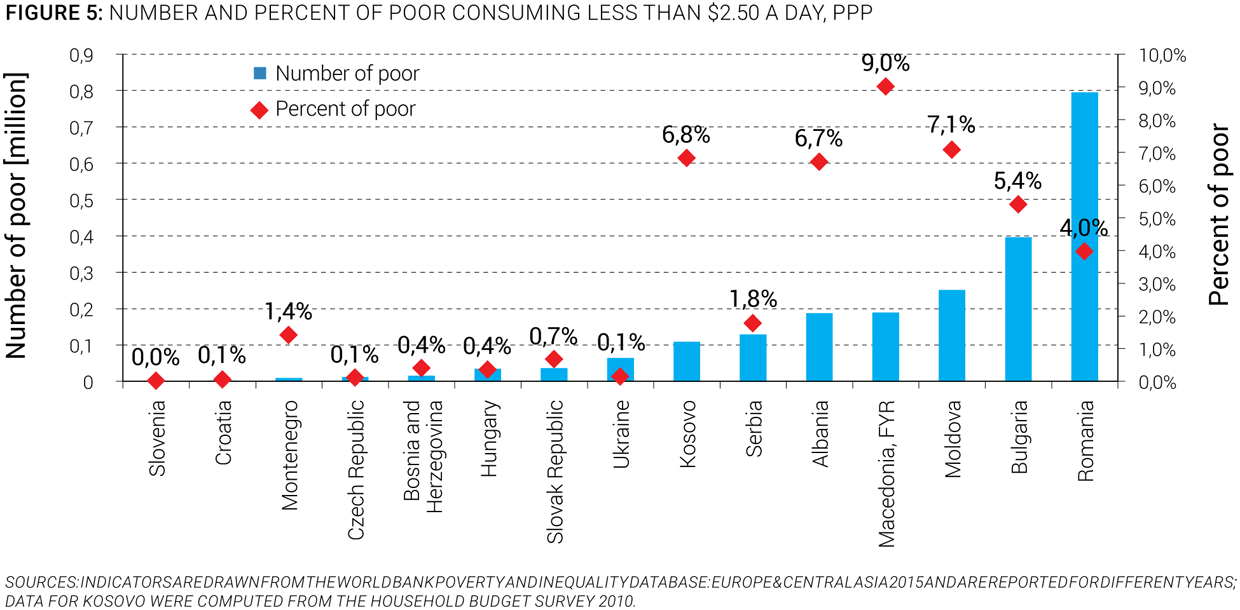
14. About 2.3 million people within the Danube water region live of less than $2.50 a day (PPP), the regional level for measuring extreme poverty. On average and excluding Austria, this means that about 1.8 percent of the total population in the area is extremely poor. As Figure 5 shows, by far the largest incidence of poverty is in Romania, which, with a population of 20 million, is the second-largest country after Ukraine. However, in terms of percentage of poor, FYR Macedonia outranks the others, closely followed by Moldova, Kosovo, and Albania.
15. The Roma community, with 10 million to 12 million members (EC 2015), is the largest and poorest minority in Europe and in the region. Although the precise number of Roma is highly debated, the largest populations reside in Bulgaria, the Czech Republic, Hungary, Romania, and Slovakia, though Roma also live in Albania, Austria, Bosnia and Herzegovina, Croatia, FYR Macedonia, Moldova, Montenegro, and Serbia, among the countries within the Danube watershed. Compared to non-Roma, Roma have the worst socioeconomic indicators in almost all areas, including health, education, work participation, salaries, and living conditions, which is why their integration and improvement has become an urgent focus of the poverty agenda of the European Commission, the World Bank, and other development partners. To demonstrate an example from a household survey conducted in 2012 in these countries, average remuneration has been found to be significantly lower for Roma in paid jobs compared to their non-Roma neighbors, and Roma children are at higher risk of poverty compared to non-Roma children living next door, as can be seen in Figure 6.

16. In Albania, FYR Macedonia, Kosovo, and Slovakia, the poor are distributed between rural and urban areas in equal proportion to the population, but in all other countries the poor disproportionately reside in rural areas. As shown in Figure 7, 86 percent of the poorest in Moldova reside in rural areas, although only 55 percent of the total population are rural based. In Bulgaria, Romania, and Ukraine, at more than 70 percent, the share of the rural poor significantly exceeds the respective share of the rural population. In some countries—notably Serbia, Slovakia, and Ukraine—the share of the rural poor increased between 2002 and 2008 (Sulla 2011). A growing share of rural poor poses a challenge to modern infrastructure services, because investments lack the economies of scale to be provided cost-effectively, and the population is unlikely to be able to afford the maintenance of modern infrastructure services. The average urbanization rate of countries within the Danube watershed is 63 percent, which is slightly higher than the country average of Central Europe and the Baltics (62 percent), but significantly lower than the rate of EU countries, at 74 percent. Overall, urbanization has been stagnant in Danube countries since the early 1990s.

17. The combination of low natural population growth and outward migration has resulted in a decline in the total number of people living in countries within the Danube watershed. From 1961 to 1989, countries experienced a joint annual increase in the population of 0.8 percent, which declined from 1990 onwards at a rate of 0.4 percent per year. Lower fertility rates and an aging population in Europe—East and West—will make Europe the only continent in the world in which the population is expected to decline over the next 40 years (Bussolo, Koettl and Sinnott, forthcoming). However, countries within the Danube watershed are already experiencing a population decline triggered by, in addition to a natural decrease, an outward migration following the opening of borders to the West (Figure 8). Although it is mostly rural areas that are depopulating, some of the urban areas have also declined in population numbers, especially those located remotely and isolated from global markets and transport corridors. This has resulted in several cities facing an oversized infrastructure that lacks economies of scale and is costly to maintain and upgrade.
