B. Water Utility Performance Index
134. As part of the utility performance analysis conducted under the State of the Sector study, there was a need to evaluate the overall performance of specific utilities. To do this, an aggregated performance index, called the Water Utility Performance Index (WUPI), has been elaborated. The WUPI seeks to emulate an expert opinion; it evaluates the performance of a single utility taking into account how closely the utility is performing to regional best practices on 10 common Key Performance Indicators. The WUPI is expressed by an aggregated score ranging from 0 (worst practice) to 100 (operating at best practice level on all indicators).
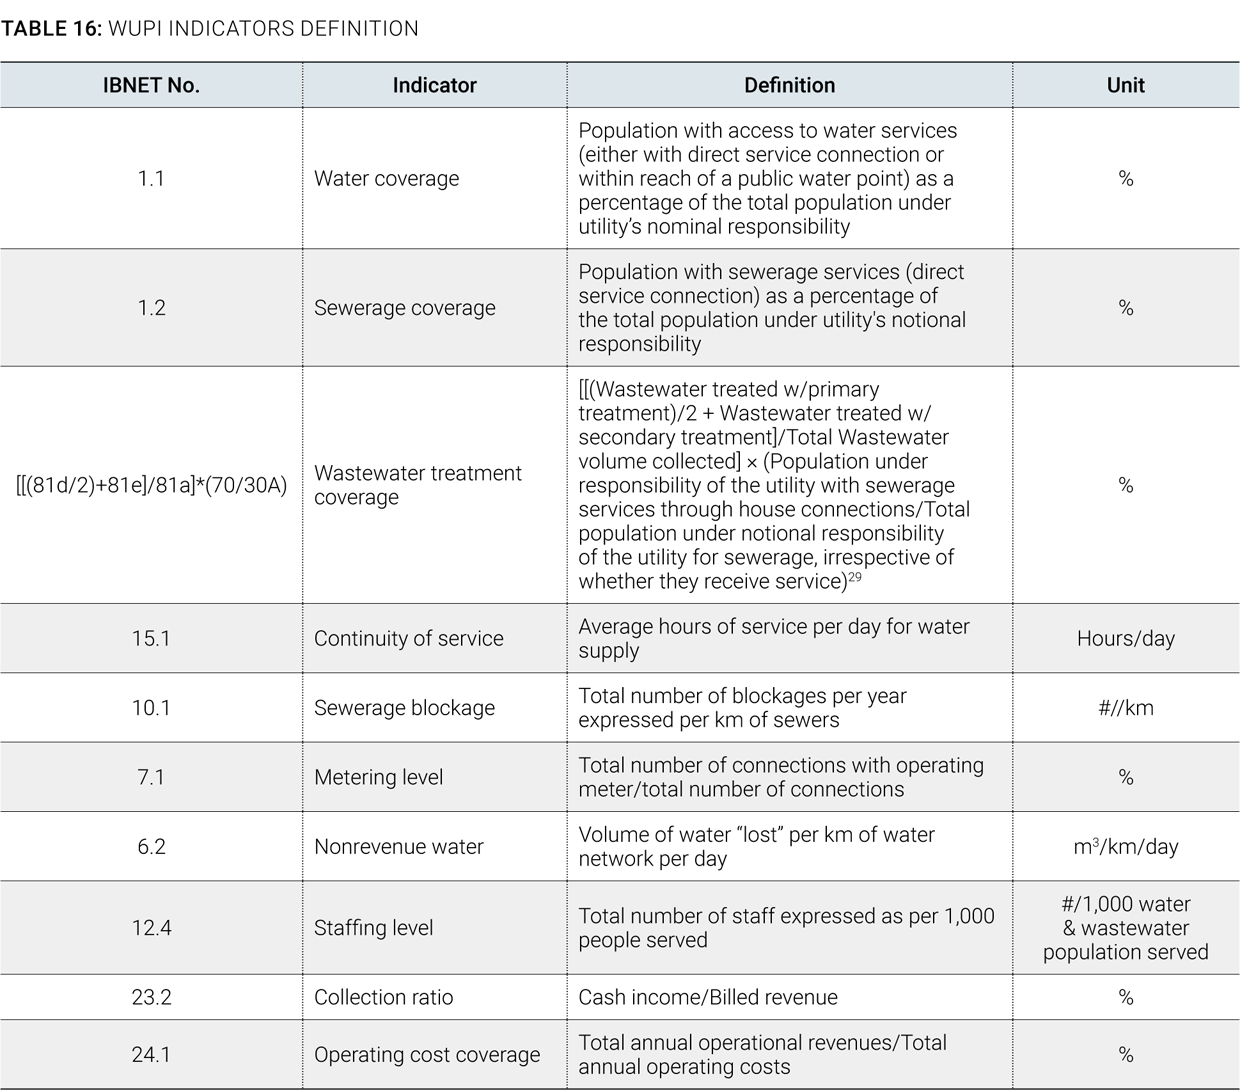
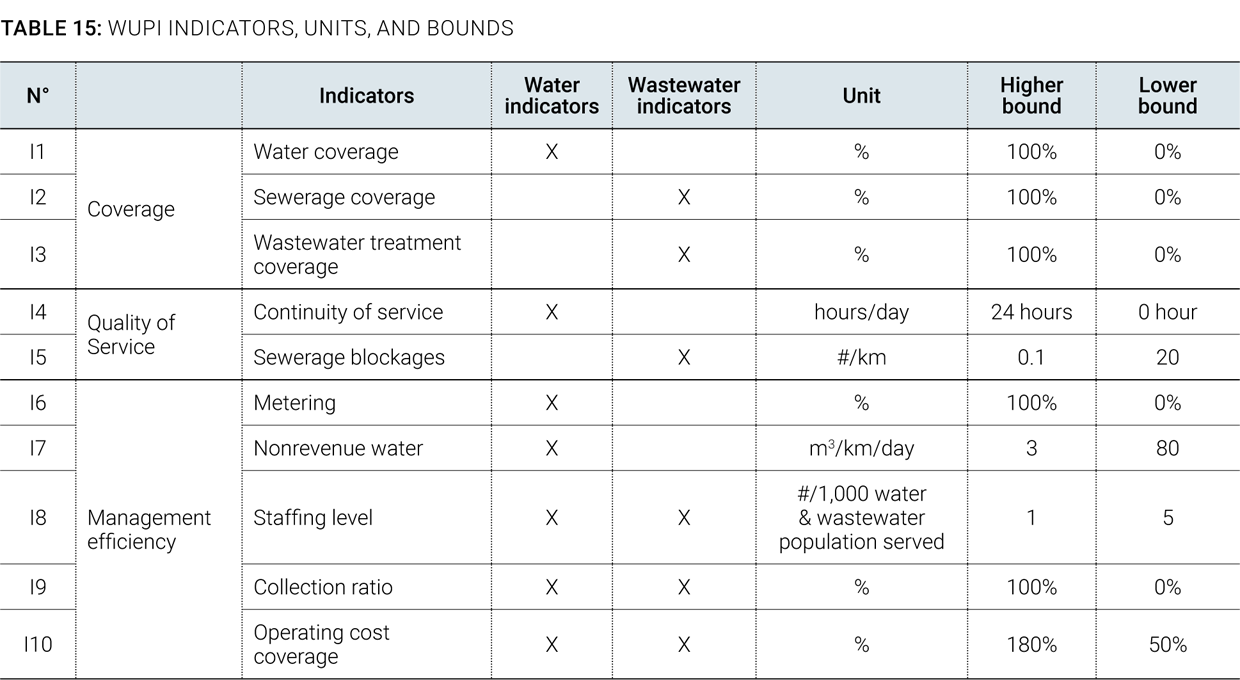
135. WUPI construction. The WUPI is constructed in a simple and robust manner. A set of 10 indicators, selected among the IBNET indicators, is used to calculate the WUPI (Table 16). For each indicator, the regional best practice value (higher bound) has been defined by using expert opinion and an analysis of the existing database (see Table 15); the lowest bound has generally been defined as the lowest possible value. The performance of a particular utility is then evaluated on the basis of a linear relationship between this lower and higher bound. Each indicator is weighted equally (10 percent) in the overall index calculation. For water-only companies, seven water-related indicators are taken into account. For wastewater-only companies, six wastewater-related indicators are taken into account, as shown in Table 15. In such cases weights are adjusted to remain equal.
136. WUPI calculation in case of missing data. The overall utility dataset is not complete; therefore, the following adjustments are made to maximize the number of utilities for which a WUPI can be computed without compromising the validity of the value:
- If indicator I1 and I2 are missing, no WUPI is assessed.
- If indicator I3 (wastewater treatment) is missing, it is replaced by the value 0, hence allowing calculating the WUPI of the utility while assuming that the utility does not provide wastewater treatment.
- When up to three “noncoverage” indicators are missing (that is, I4 to I10), the average of all other noncoverage indicators is used to fill up the missing values. If the utility has more than three “noncoverage” indicators missing, then the WUPI is not assessed. This calculation process and threshold have been elaborated based on correlation tests that show that WUPI scores remain robust when removing up to three indicators, since correlation is above 80 percent to 90 percent.
137. WUPI robustness and validation. Due to its construction, the WUPI is a best practice indicator (Table 16). For given cost/expenditures, higher values represent better performance. The indicator is therefore similar to the APGAR indicator by IBNET (van den Berg and Danilenko 2011), and is highly correlated to it (0.77). The overall WUPI rating for a subsample of utilities was also shared with experts from the region who did not detect significant inconsistencies with their own professional judgment. Furthermore, the correlation between the WUPI based on the full set and the WUPI where one, two, or three indicators are dropped is very high. In the case where one or two indicators are dropped, all correlations are above 0.90. Even in the case where three WUPI indicators are missing, only 1 out of 35 correlations with 0.88 is below the 0.90 threshold. These findings confirm that calculating the WUPI based on only a subset of the indicators does not introduce significant bias. A more detailed discussion of the construction and validation of the WUPI and its use throughout this report is included in Klien 2015.