B. Services Expenditures: Operating and Investment Costs
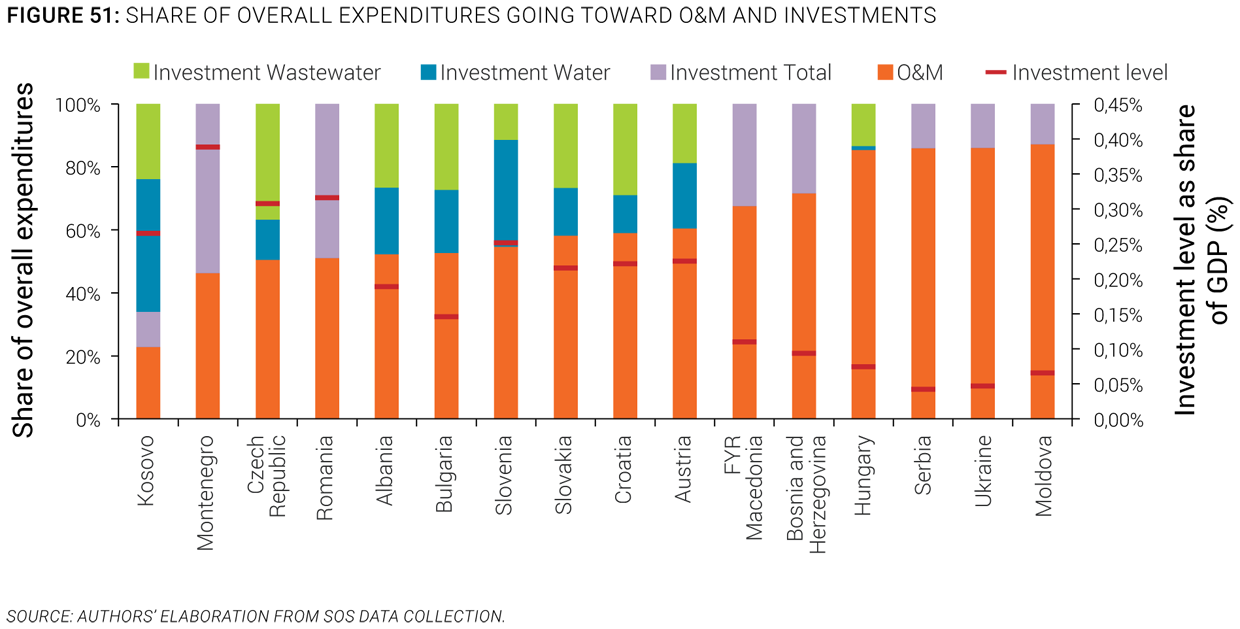
106. On average, the sector directs about half of overall expenditures toward operating and maintaining (O&M) infrastructure, and half toward renewing or expanding it. Figure 51 shows the proportion of overall costs going toward O&M and toward investments for countries in the region. There is an important variation among countries, with the share of overall costs going toward investments varying between one-third and two-thirds. The superimposition of levels of investment (as a percentage of GDP) on the same figure logically shows that countries that have a very high expenditure going toward O&M are those that also spend less on investment overall, raising potential concerns about long-term service sustainability. In those countries for which data are available, investments in wastewater are a priority, a reflection of the gaps in service levels compared to water supply (Chapter IV). Furthermore, the significant share of sector resources going toward investment shows the importance of carefully managing and developing assets, and applying the principles of efficiency not only to the operating of water utilities, but also to the planning and implementation of investment projects. In that respect, the particularly low levels of investment (as a share of GDP) in countries such as Moldova, Serbia, and Ukraine, and to a lesser extent Hungary, should raise questions about whether assets are properly managed and maintained in the long run or tariffs are maintained artificially low by living off assets, which will eventually result in reduced service quality.
107. Total water and wastewater investments in the region are around €3.5 billion a year, significantly lower than the €5.5 billion estimated by the region’s governments to be needed to achieve EU or national targets. Governments or external financiers in most countries have estimated the amounts needed to achieve each country’s own targets or to comply with the EU acquis, and the combined national estimates amount to €5.5 billion of necessary investment annually. Actual investment levels are around 55 percent of this level, leaving a gap of more than €2 billion a year (Figure 52). Overall, about 40 percent of all investment needs are directed at water supply and compliance with the Drinking Water Directive, while 60 percent are for wastewater management and compliance with the Urban Waste Water Treatment Directive (see section B in Chapter III for more details on both directives, and Chapter IV for a discussion on the infrastructure gap). Furthermore, a country-by-country review of projected investment needs and current investments (Figure 52), shows that:
- Most countries project investment needs higher than their current levels of investment. Only the Czech Republic has investment levels generally at the level of its projected needs.
- EU members and candidate countries project higher investment needs than non-EU members; even Austria, where access to wastewater services is already high, projects significant investment needs largely because of the need to renew assets built in the first wave of wastewater investments, around 30 years ago.
- More recent EU members—Bulgaria, in particular—are still struggling to absorb EU funds efficiently and show significant funding gaps.
- Most countries outside the EU have significantly lower investment levels and generally do not currently cover their needs.
