A. Sustainability of the Water and Wastewater Services across the Region
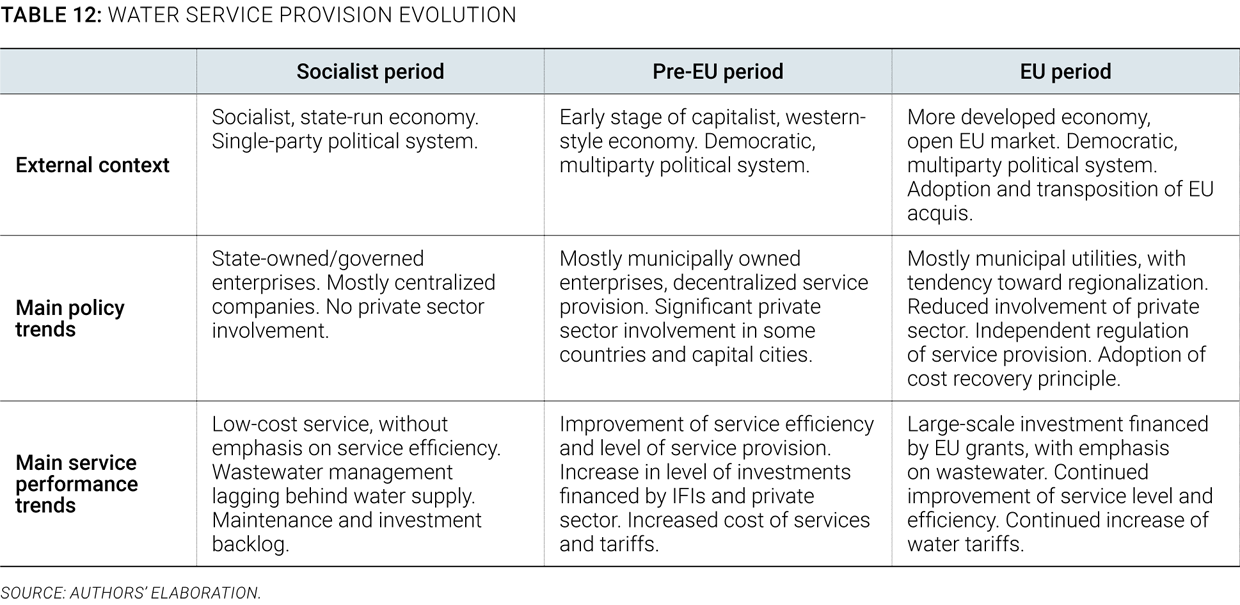
120. The water sector has been strongly impacted by the region’s overall trajectory over the last 30 years, from the socialist period, to the transition period, into the EU accession process. While countries throughout the region are at different stages of their own development, most share a similar trajectory toward European integration, which conditions, indirectly and directly, the development of the water services sector. Table 12 summarizes the main components of this evolution in terms of the external context and the main policy and service performance trends, which helps provide context for the overall conclusions presented in this chapter.
121. The overall services sustainability assessment shows there is a significant gap between EU levels and the performance of EU candidates and non-EU countries, which might require a different approach to their accession. Figure 61 shows the results of the services sustainability assessment, combined for the following groups: EU members, EU candidate countries, and non-EU countries, for each of the four dimensions and 12 indicators of the assessment. It is clear from the rest of the report that there is a wide diversity of situations in the region, but the figure highlights once again the significant gaps existing between EU members, candidate countries, and non-EU countries. Those gaps, not just in access, but also in service quality, efficiency, and financing, appear to be much larger than the gaps the recent EU members faced when they joined. In the context of an overall EU accession effort, decision makers on all sides should reflect on whether the time and financial and normative frameworks that have helped recent EU members meet the requirements of their accession treaty are still the adequate ones for candidates with much larger gaps, or whether they should be rethought to take into account broader sector development needs.

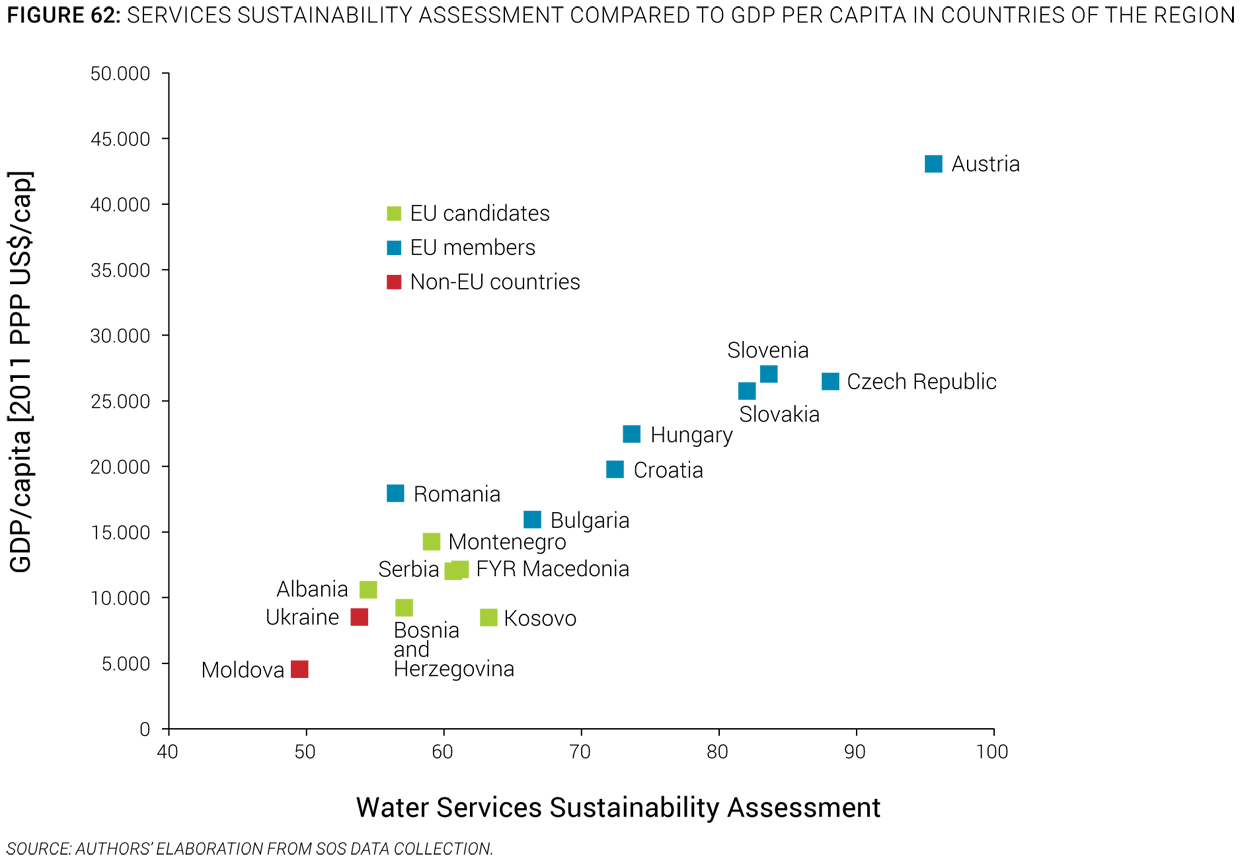
122. Beyond the EU accession framework, the assessment also shows that despite a general correlation between economic development and services sustainability, some countries appear to outperform their peers. A plot of the services sustainability assessment for different countries against the level of GDP per capita (Figure 62) shows a clear correlation between economic development and water services sustainability assessment. EU members lead the region in services sustainability and economic development, with a few interesting exceptions. For example, the Czech Republic performs much better than Slovakia and Slovenia at the same level of GDP per capita; conversely Romania appears to face higher challenges than other countries at the same level of economic development, largely because of the much higher share of rural population in the country. The EU candidate countries present relatively similar levels of services sustainability, but Kosovo, for example, has the most sustainable sector among those despite having the lowest GDP per capita, possibly because of a clear and stable sector organizational framework (see Box in Chapter III). Finally, Moldova, the least economically developed country in the region, also faces the greatest gap in achieving universal, efficient, and sustainable services.
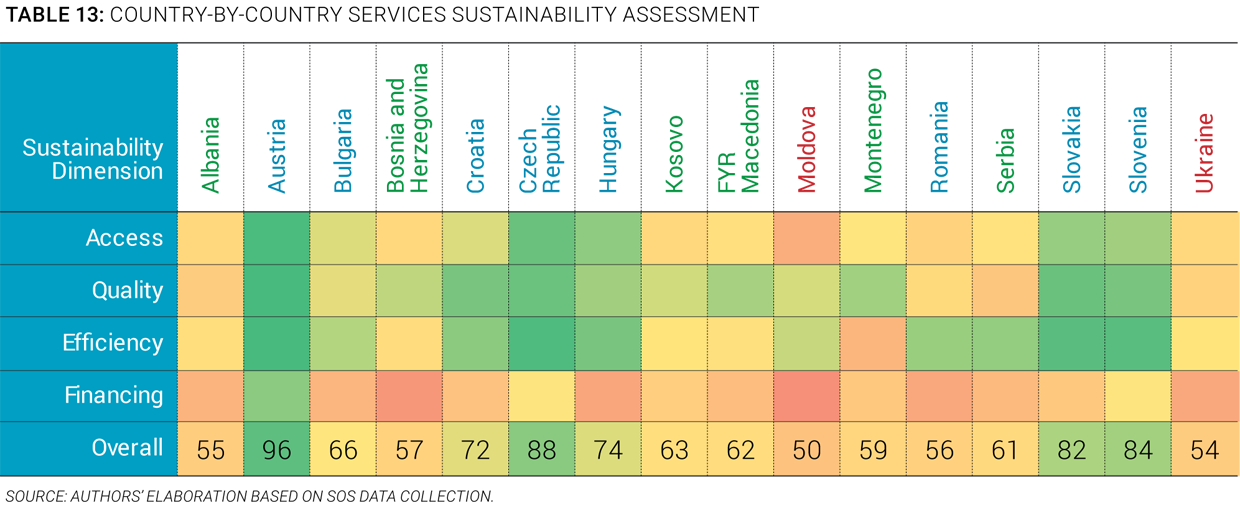
123. Although each country is at a different stage, all have areas in which they can further improve. Table 13 identifies, for each country, the overall score and qualitative outcome for each of the four dimensions of the assessment. As the table shows, most EU members do well providing access to services for all, and most countries in the region offer reasonably good service quality to those connected to public supply. The efficiency agenda is highly relevant for most of the recent and non-EU member countries. Sound sector financing remains an issue throughout the region, with some exceptions in older EU Member States.