C. Overall Performance Trends and Drivers
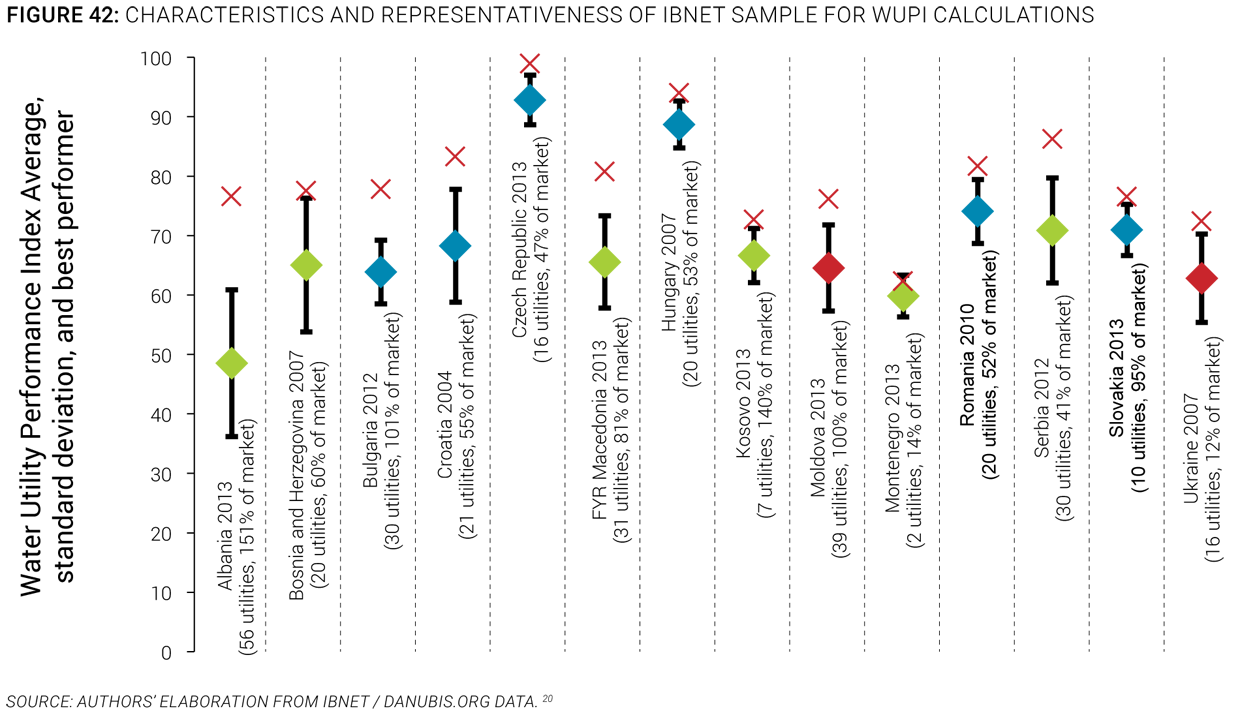
90. To complement the descriptive analysis of sector performance presented in the previous chapters, an econometric analysis of utility performance trends and drivers was performed. Such an analysis makes it possible to analyze the data more rigorously and draw conclusions that are substantiated statistically. For that purpose, the full IBNET dataset available for the countries in the region was used. In addition, an aggregated performance index, the Water Utility Performance Index (WUPI), was defined (see box) to measure the overall performance of utilities (in terms of service coverage, service quality, and management) against various parameters. The IBNET dataset is, of course, not representative in all countries (Albania, the Czech Republic, Kosovo, and Moldova are the most complete, while Austria and Slovenia are entirely missing and data are outdated in Bosnia and Herzegovina, Croatia, and Ukraine, and very partial in Montenegro), and also reveals significant in-country deviations (Figure 42). However, by using advanced statistical methods, the robustness of the results presented can be confirmed, and the following paragraphs include only conclusions that have been thoroughly vetted. More details about the corresponding analysis can be obtained from an SoS supporting paper, Klien 2015, available from the SoS.danubis.org website.
The Water Utility Performance Index
The WUPI is a simple index measuring how closely a utility company operates to accepted good practices. The index is based on 10 dimensions generally accepted as key performance indicators in the industry and available from the IBNET dataset for most utility companies in the region. Those dimensions fall into three categories: coverage (water, sewer, and wastewater treatment); quality (service continuity and sewer blockage); and management (metering, NRW, staff productivity, collection rate, and operating cost recovery). For each dimension a score of 1 to 10 is computed measuring how close a given utility is to regional good practices. The sum of all scores gives the WUPI, with 100 (best practice on each dimension) being the best score. For more details, see Methodological Note B at the end of this report.
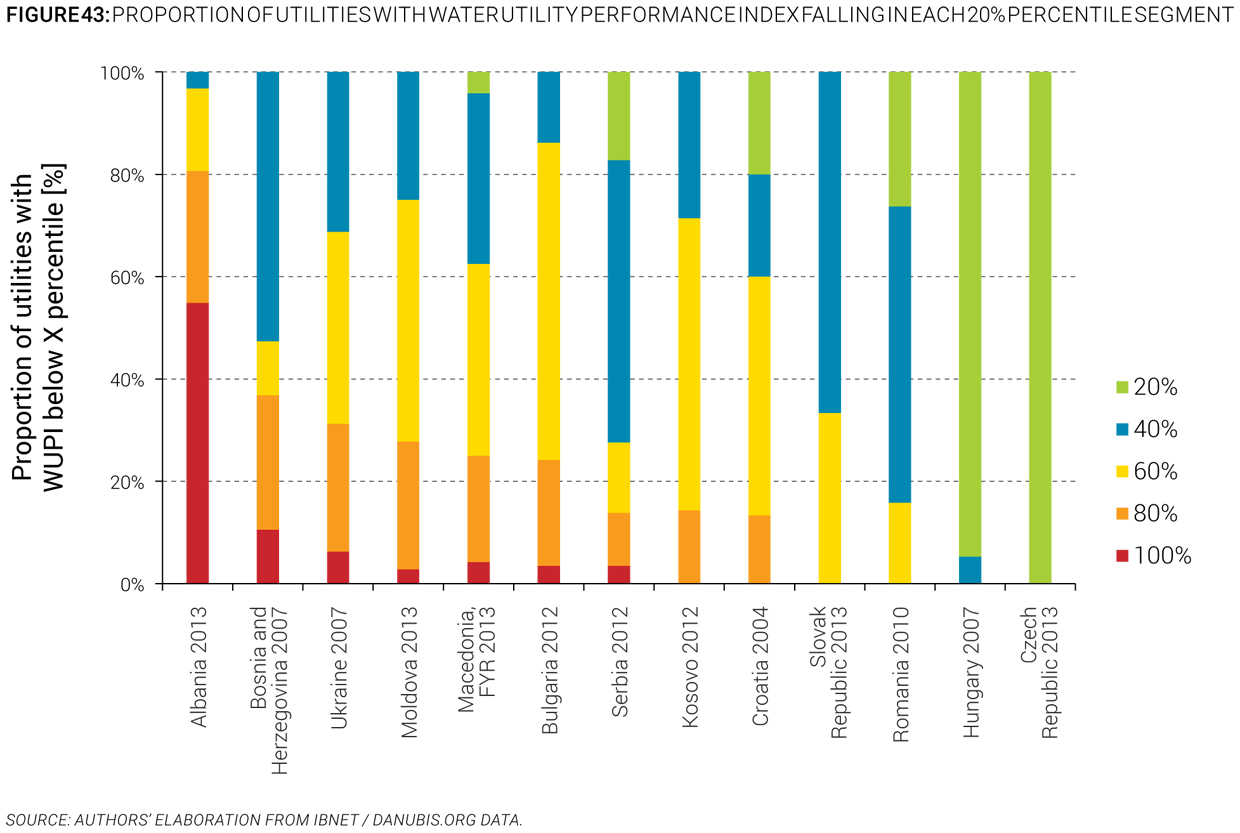
91. Perhaps not surprisingly, the performance of utilities varies widely within countries, but generally increases with the level of economic development of the country. Figure 43 shows in which performance quintile utilities in each country fall. For example, 100 percent of the utilities in the Czech Republic were among the 20 percent of best performers in the region in 2013. Not surprisingly, utilities in the countries that were among the first to join the EU (the Czech Republic, Hungary, Slovakia) also perform particularly well, whereas countries that are farther away from joining the EU have a larger proportion of struggling utilities. Also, while in many countries the performance of utilities is relatively homogenous, in a few countries such as Albania, Bulgaria, and Serbia, there is much more dispersion of performance. This is particularly important because it indicates that in those countries, the enabling environment is such that it is possible to perform at a high level, yet many utilities do not do so.
92. Overall, the performance of water utilities has improved over the last 10 years. The previous paragraphs and chapters have already shown positive trends in the region, particularly with regard to sewerage and wastewater treatment services coverage, as well as utility efficiency. Those trends can be confirmed by an aggregated analysis of the Water Utility Performance Index. Figure 44 shows, for example, the proportion of utilities in the overall sample that fall under each quintile of performance during 2000-2007, for which the sample is relatively consistent in terms of country participation. The share of worst performers decreased during this period from 10 percent to 5 percent of the sample, whereas the share of best performers increased from 28 percent to 40 percent. A similar trend can be observed for the average WUPI of the sample, which increased from 67 to 73 during the same period. The trend is further confirmed that in the overall sample, the WUPI of utilities in the last year they appear in the database is 3.7 points higher than the first year they appear (Klien 2015).
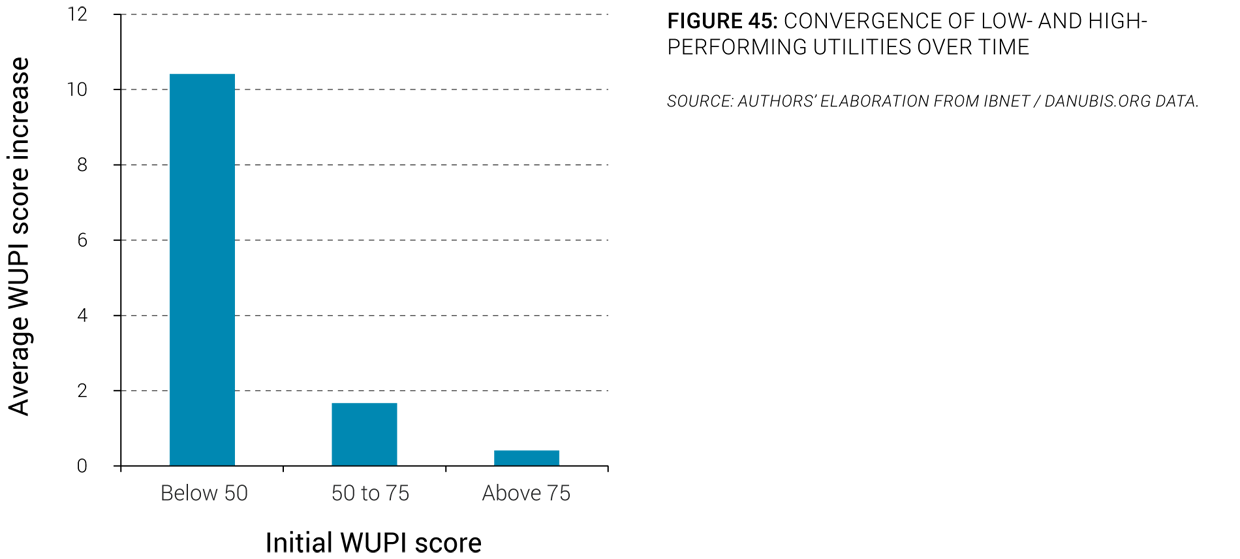
93. The region’s utilities also show a converging trend toward better practices. The analysis shows that utilities that start with a lower score show higher improvements than utilities that already have a higher score at the beginning, hinting at a convergence of the overall performance of utilities in the region toward better practices (Figure 45). The detailed analysis also shows that most utilities perform relatively consistently over different dimensions, meaning that utilities that show a high level of service coverage or quality also tend to show better managerial indicators, for example.
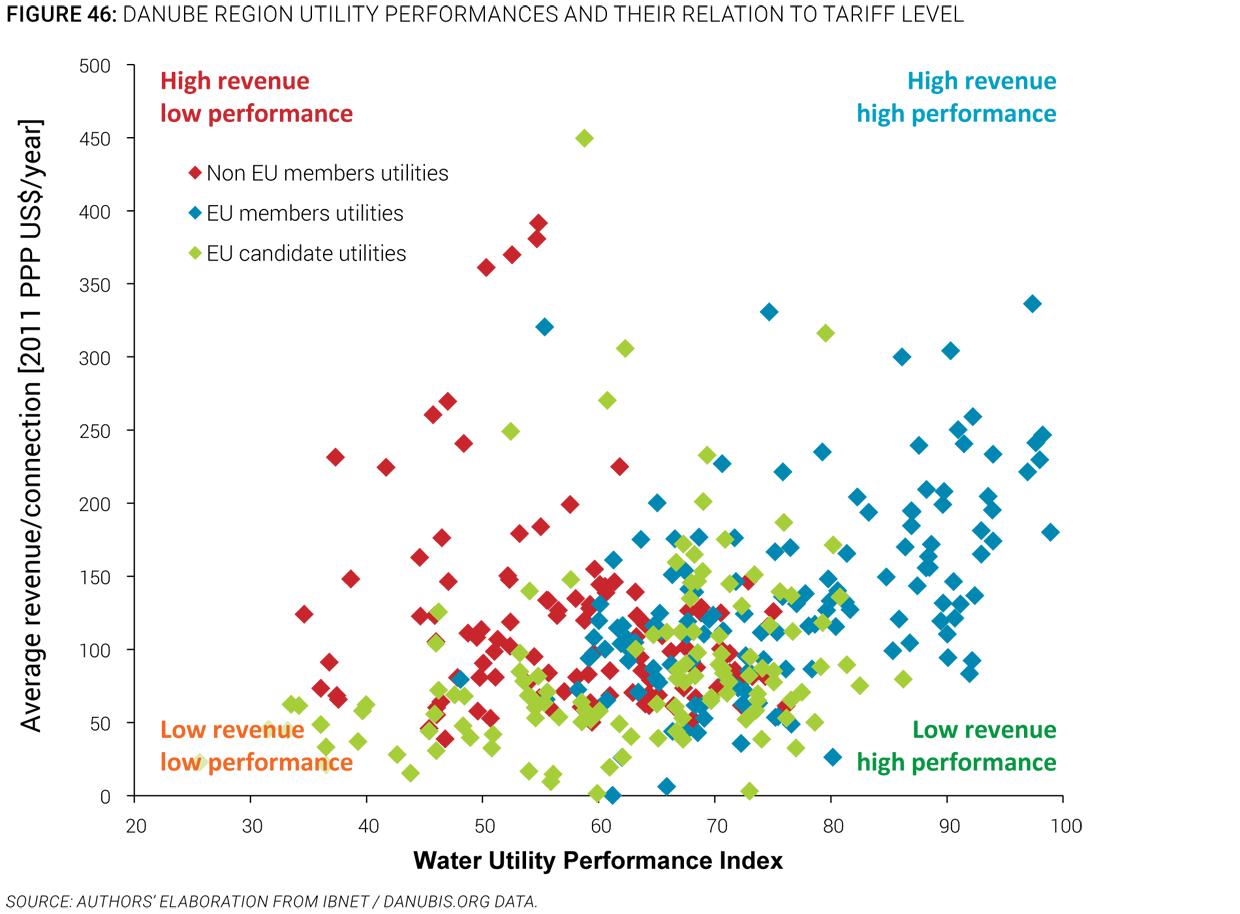
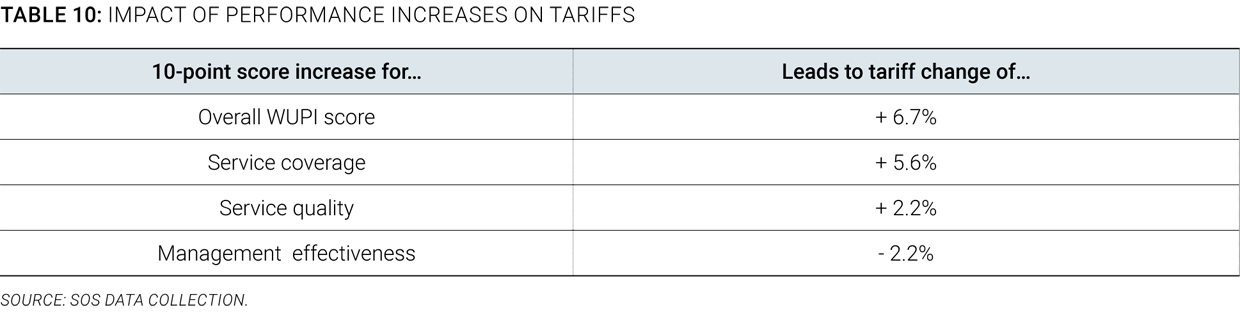
94. Utilities displaying better performance also generally have higher tariffs. A scatterplot of utility performance against average revenue per connection (taken as a proxy for average tariff) shows a wide dispersion (Figure 46), with EU member utilities having generally higher performance, and non-EU member utilities having a higher tariff income per connection (in PPP terms) than utilities from EU candidate countries. Overall, however, Figure 46 and underlying analysis show that utilities that display better performance also tend to have higher tariffs. In other words, quality has its cost, and it is particularly telling that no utility with high performance simultaneously offers low tariffs (bottom right corner of the figure). Conversely, though, there are many low-performing utilities with relatively high tariffs, which should engender questions from those holding them accountable. A more detailed review of the data shows that utilities with higher service coverage and quality (the first two groups of WUPI dimensions) tend to have higher tariffs, while utilities with better managerial practices (the last WUPI group of dimensions) tend to have lower tariffs (Table 10). Unsurprisingly, though, the savings from improved management practices are not sufficient to compensate for the higher revenues needed to sustain the better services, and an overall improvement of 10 points in the WUPI score is associated with a tariff increase of 6.7 percent (Table 10).
95. At the country level, the drivers for utility performance appear to be largely external to the sector. A systematic econometric analysis of utility performance against a range of external drivers reveals mixed messages. Much of the variation in performance in the sample can be explained by country context—which is largely beyond the reach of sector policy makers. In other words, some countries (Austria, for example) simply offer better conditions for utilities to be successful than others. More specific policy changes, such as the establishment of a formal regulatory framework or the EU accession and membership process, cannot be shown from the dataset to demonstrate a clear short-term impact on utility performance. However, this is largely driven by constraints from the available data and cannot be taken as the basis for policy recommendations; anyway, such reforms take significantly longer to demonstrate impact than the time series available in the database.
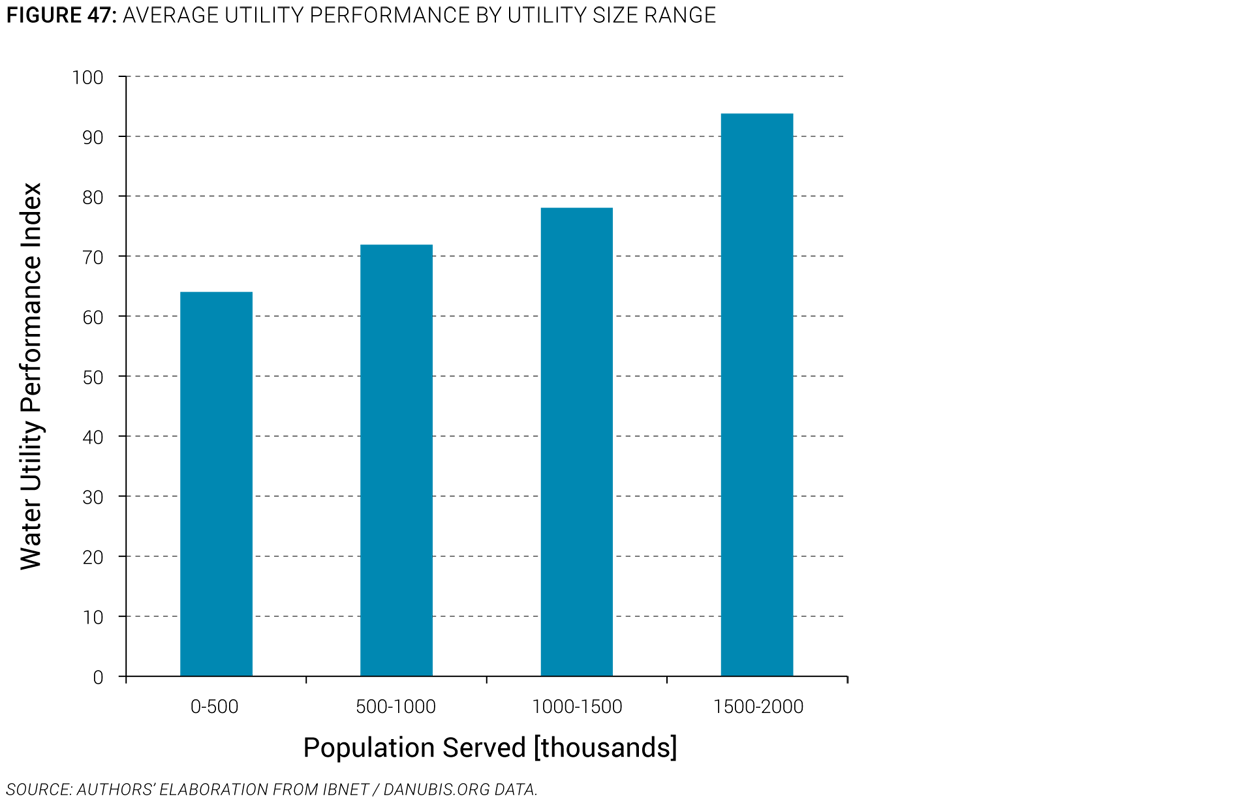
96. At the utility level, however, some clear drivers of performance, such as size and density, emerge, but they are difficult to translate into concrete policy recommendations. Utility governance models tend to be relatively similar for most utilities in a given country and within a given size range. The dataset, therefore, does not allow conclusions on which utility governance models might provide better results. The analysis confirms, however, that the water sector, like many others, is prone to economies of scale, and utilities that are larger and/or serve denser areas are more likely to have better performance and lower costs than their peers, everything else being equal (Figure 47). It is, however, important to consider that those benefits cannot easily be reaped by changes of sector policies. The density or size of a city are equally beyond the reach of sectorial policy makers, and the mere aggregation of several operators into larger ones does not produce the same clear outcome (see paragraph below).
97. The impact of regionalization or aggregation processes on utility performance and cost is not unambiguously positive, and policy makers should carefully weigh the particular circumstances of their country before promoting such processes. In an attempt to achieve economies of scale and ensure more professional and financially stable service providers, a number of countries are turning toward the aggregation or regionalization of service providers (see Section A in Chapter III for more details). The analysis of the dataset, based on a rigorous difference-in-differences approach (Klien 2015), does not allow general conclusions to be drawn, and each country should evaluate the pros and cons of a regionalization process. Contrary to generally held opinions with regard to the positive impact of regionalization or aggregation processes on overall performance and costs, the analysis offers a number of cautionary tales showing, for example, that:
- Aggregated utilities perform only marginally better, on average, than similar utilities that do not go through an aggregation process. The most positive impact occurs on managerial performance, while service quality is unaffected and coverage is negatively affected. The actual overall impact depends on the characteristics of the merged utilities (size, performance) and on the merger process itself (number of merged utilities, overall increase in size).
- Aggregation processes involving fewer utilities and generating denser service areas provide positive benefits, whereas mergers with large numbers of utilities and limited gains in density or population served tend to return negative impact on overall performance and costs.
- Smaller utilities that merge or aggregate reap higher benefits (in terms of costs and performance) from aggregation than larger utilities, indicating that economies of scale are nonlinear and large utilities cannot expect to further improve their performance or reduce their costs by growing.
- The effects of aggregation processes are most marked in the first few years after the merger, and tend to dissipate over time.