C. Cost Recovery: Cost and Tariff Trends
108. The costs of providing services varies widely from country to country but have grown significantly over the last 20 years, leading to parallel tariff increases. The chapters on access to services (Chapter IV) and utility overall performance (Chapter V) have demonstrated how the sector’s overall performance has improved, in terms of coverage and quality of services, in the last 20 years. The necessary investments, in particular for the extension of wastewater collection and treatment, have been matched by significant increases in overall operating expenses. Figure 53 shows the evolution of operating costs in a sample of water and sewerage utilities, with increases in many countries, particularly EU members, going beyond 100 percent in constant PPP. Figure 54 shows how utilities have had to grow their revenues in a similar fashion, largely through tariff increases. Despite decreasing consumption, per-connection revenues grew at an annual rate of more than 10 percent (in real terms) in utilities of new EU members such as the Czech Republic and Romania, and to a lesser extent, Hungary. Even in non-EU members such as Kosovo, Moldova, and Ukraine, utility revenue increases averaging 5 percent per year in real terms were observed over sustained periods of time. Such steady increases, in the absence of sustained and broad-based economic growth, can lead to serious affordability constraints, as will be discussed in Section D of this chapter.
 |
 |
109. Both O&M costs and residential tariffs generally follow the level of economic development of countries, with costs and tariffs highest in EU member countries. As Figure 55 shows, there is a relatively close relationship between O&M costs and residential tariff levels. Austria clearly shows the highest costs and tariffs, followed by all EU members except Bulgaria, where costs and tariff levels are significantly lower than those in the other EU member countries. In contrast, most countries of the Western Balkans have tariff levels far below the regional average, despite the fact that affordability is not generally a constraint, as will be discussed in Section D of this chapter.

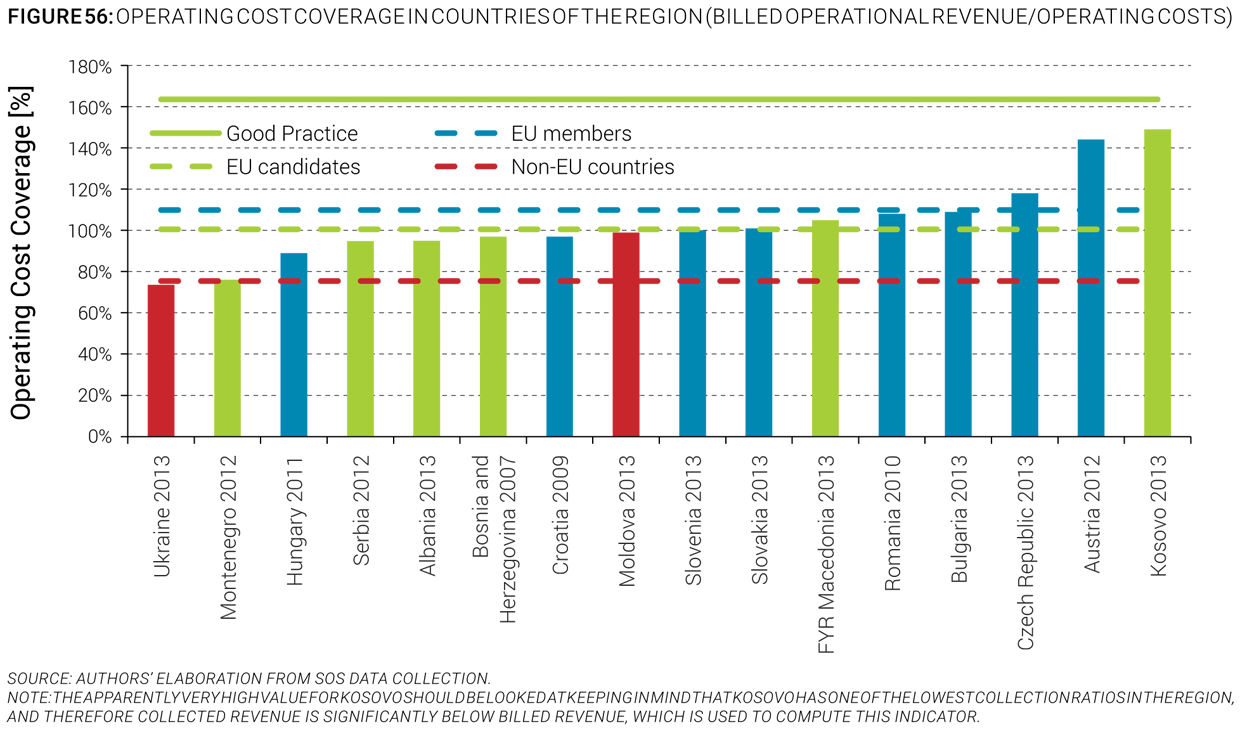
110. Full cost recovery from tariffs does not appear to be a priority in any country, and many utilities in the region do not even cover their operating costs from billed revenues. To maintain service quality in the long run, utilities should be able to recover their operating and regular maintenance costs, as well as those necessary for asset management and renewal, from their own revenues. Figure 56 displays the average operating cost coverage of utilities in the region, measured as the net billed sales over operating expenses, including depreciation; utilities should have an operating cost coverage above 1 to be financially self-sufficient in terms of O&M. As the figure shows, only in a minority of countries do utilities recover all of their operating expenses from own revenues. While the average for EU member countries is above one, even some EU member countries such as Bulgaria, Hungary (where strong tariff controls are in place), and Romania, which formally fall under the EU WFD requirement of cost recovery, do not appear to fully comply. The overall situation is not particularly positive, especially considering that utilities in a number of countries fail to collect a significant share of billed revenues (see Figure 41), and therefore the actual ability of utilities to finance themselves is even lower (provisions are seldom made for accounts receivable write-offs).